WinPicks Reference Manual
Section 9.2. Displaying and Saving Trends Using Team History
The team history display shows the performance history for the selected team(s). A sample screen is shown in Figure 9.20:
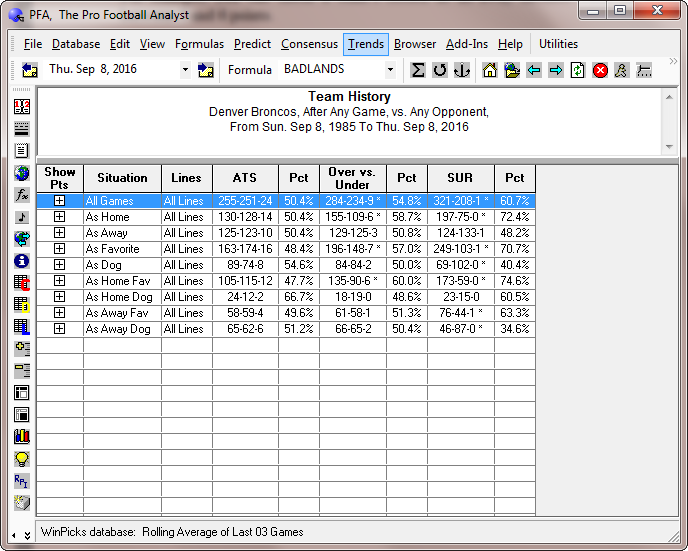
Figure 9.20 - Viewing a Team History (PFA)
The title at the top of this screen explains which data has been included in the team history. This data is further broken down into nine situations, with each situation having its own line on the grid:
- All Games
- As Home
- As Away
- As Favorite
- As Dog
- As Home Favorite
- As Home Dog
- As Away Favorite
- As Away Dog
The screen shows how the selected team(s) has fared in each situation by listing their against the spread record (ATS), their over/under record (Over vs. Under), and their straight-up record (SUR). The winning percentage in each situation is also shown (Pct). Records that show a statistically significant trend are marked with an asterisk. Keep in mind that some situations will not contain any games. For example, if you have customized team history to only include home games, all situations involving road games (Away, Away Favorite, and Away Dog) will remain blank.
The leftmost column of the TEAM HISTORY screen (Show Pts) contains a small white box with a plus sign (+) inside. If you click on this box, the plus sign becomes a minus (-) sign. At this point, the window expands, and the situation is broken down further based on the size of the point spread. This allows you to quickly research trends that would be nearly impossible to find anywhere else. For example, you can check a team's record as an away favorite when the point spread was between 3 and 6 points.
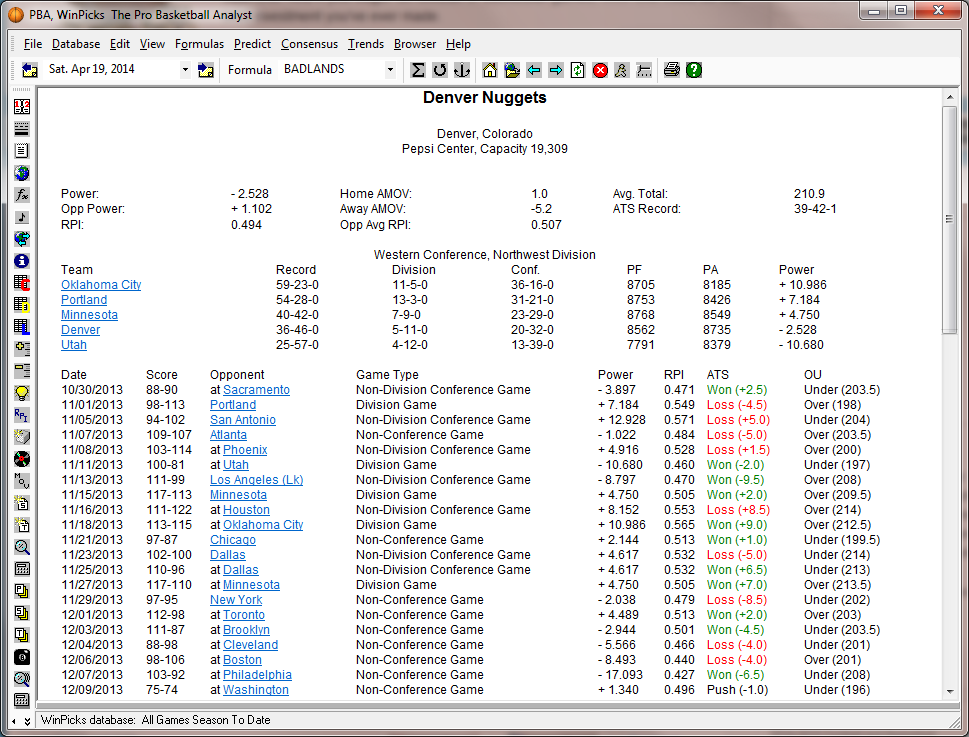
If you select any situation in the TEAM HISTORY grid, the history viewer window appears (Figure 9.21). The window title shows which options have been selected. It also shows the average points scored and allowed in this situation, and the average margin of victory (MOV). This window contains a list of games that match your selection criteria. It shows the game date, the team names, score, line, and totals line (Total) for each game (if numbers are available). The ATS column indicates whether the selected team covered against the spread (WON), or failed to cover (LOST). The OU column indicates whether the game went over or under the totals line. The folders on the left side of the window allow you to select past games or future games, so you can find upcoming games on the schedule that match this trend. If you right click the mouse button on any game in the history window, a window appears showing the previous game result.
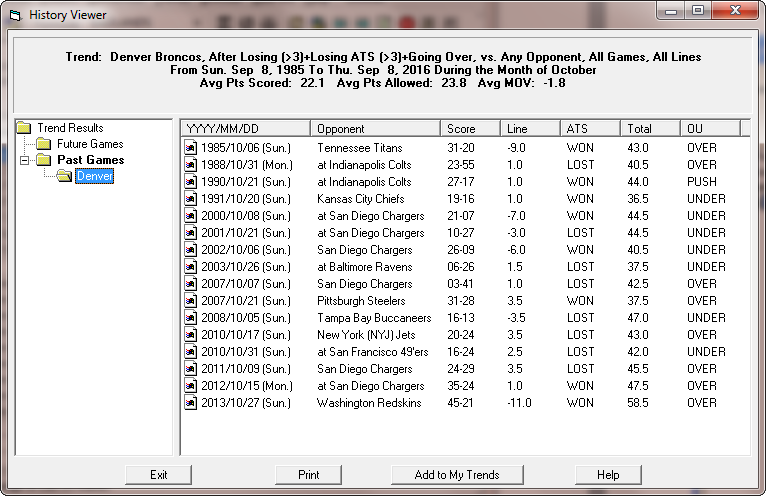
Figure 9.21 - The History Viewer Window (PFA)
Saving a Trend
You can save any trend that you find to a list of your own personal trends that you want to follow in the future. This feature is known as MY TRENDS. To add a trend to MY TRENDS, simply click on the ADD TO MY TRENDS button shown in Figure 9.21. Note that you can only save an ATS or an O/U trend with MY TRENDS, trends relating to SUR cannot be saved. However, conference trends can be saved as well as team trends. Once you add a trend to MY TRENDS, you'll be able to view it again later, or use it to generate a trend alert.