WinPicks Reference Manual
Section 9.8. Set Trend Options
When you use TEAM HISTORY or any of the other trend features in WinPicks, you may notice that some trends are marked with an asterisk (*). When you see an asterisk, it means that the team in question has done much better (or much worse) than average in this situation, and therefore this trend is considered to be statistically significant.
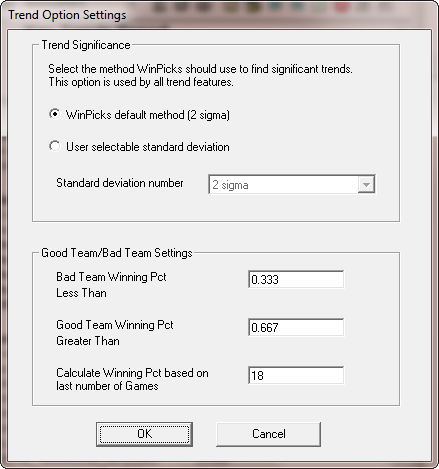
By default, WinPicks identifies trends that are more than two standard deviations from the mean as statistically significant. However, you can vary the number of standard deviations from 1 to 4 by selecting SET TREND OPTIONS from the the TREND menu (Figure 9.80). This feature also allows you to change the settings that determine good and bad teams. By default, good teams are defined as having won more than 66.7 percent of their games over a period equal to about one season, and bad teams are defined as having won fewer than 33.3% of their games over the same interval. However, you can change the parameters to anything you wish.

Figure 9.80 - The Set Trend Options Window
If you want to learn more about standard deviation, nearly any book on statistics will explain how to calculate it. However, one simple way to illustrate standard deviation is to empty a box of toothpicks onto a flat surface. When the toothpicks come to rest, most will remain clustered near the spot where they landed. This spot represents the average or mean. You'll probably see toothpicks spread out around the mean in a fairly consistent fashion. Statisticians call this normal distribution. As you get further and further from the mean, you'll see fewer and fewer toothpicks. If you recorded the final resting position of each toothpick and used the numbers to calculate standard deviation (distance from the mean), you would find that there is a high probability (about 68%) that a given toothpick will come to rest within one standard deviation of the mean. If you used two standard deviations (double the distance from the mean), you would find that there is a 95% probability that a toothpick will land within this range, or only a 5% probability that a toothpick will land outside this range.
The trends marked with an asterisk are just like the toothpicks that defied the odds and landed far away from the mean. They represent situations that are out of the ordinary, and thus deserve the attention of every handicapper.


