Viewing and Printing Data
WinPicks Reference Manual Section 7. Viewing and Printing Data
All members of the WinPicks family let you view, print, or graph data in a variety of formats. You can also view or print the current standings. You'll find that WinPicks provides you with quick access to just about any kind of statistical information.
Whenever you view, print, or graph data, you'll be using the data that is currently part of the database. For example, a season to date database provides all of the data from the current season. To change the database method, please see Section 4.
This section covers the following topics:
- 7.1 - Viewing Team Information
- 7.2 - Viewing the Standings
- 7.3 - Viewing Statistics with Pro Football Analyst
- 7.5 - Viewing College Football or Pro Basketball Statistics
- 7.6 - Power Ratings
- 7.7 - Schedule Difficulty
- 7.8 - Records
- 7.9 - Inter-Conference and/or Inter-Division Records
- 7.10 - Key Factors
- 7.11 - Viewing Non Division-1 Teams (CFA and CBA only)
- 7.12 - Viewing Stadiums and Arena Information
- The Weather Board and the Weather Lab (Pro Football Analyst)
Viewing Team Information
WinPicks Reference Manual Section 7.1. Viewing Team Information
To get started, select TEAM INFO from the VIEW menu and select a team from the list. The TEAM INFO screen appears as shown in Figure 7.10.
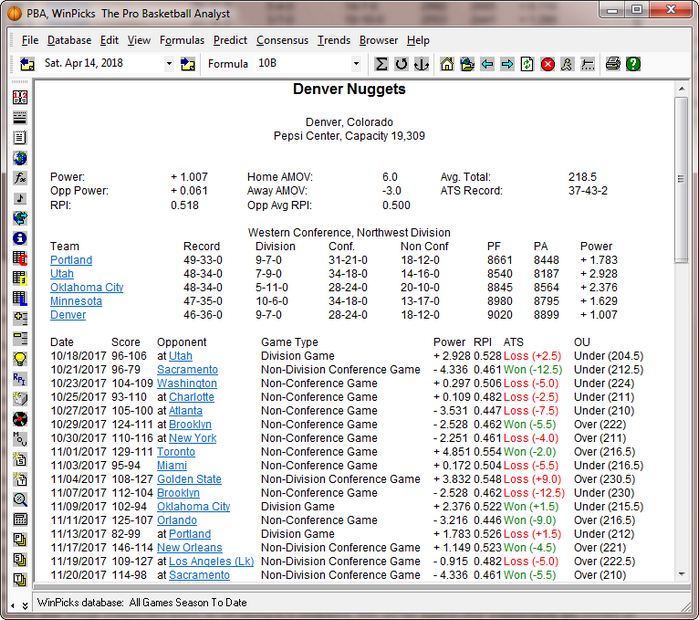
Figure 7.10 - The Team Info Screen (PBA)
The top of the team info screen shows the team name, the city and state where they play their home games, and the name and seating capacity of their stadium or arena.
The next part of the team info screen provides a two-line summary of some valuable handicapping data. This summary consists of three columns of data each containing two lines of information. The left column shows the selected team's power rating (Power) and the average power rating of their opponents (Opp Power), as well as the team's Rating Percentage Index (RPI). The middle column shows the selected team's average margin of victory in their home games (Home AMOV) and away games (Away AMOV) and the average RPI of the team's opponents (Opp Avg RPI). The right column shows the average number of points scored by both teams (Avg Total) in games involving the selected team, and the selected team's record against the point spread (ATS Record).
The two-line summary is followed by the standings for the team's division. The standings show each team's overall record (Record), their record within their division (Division), and their record within their conference (Conf) and outside their conference (Non Conf). It also shows the total number of points scored by each team (Pts Scored), the number of points allowed by each team (Pts Allowed), and the power rating of each team (Power). You can display the view team report for other teams in the division by simply clicking on their name.
The information in the standings is straightforward for NFL and NBA teams, but a few things need to be noted about college football. First, division records are only listed for conferences that are divided into divisions (SEC, MAC, Big 12, and so on). Second, even though independent teams do not belong to a conference, their games against other independents are counted as conference games. Therefore, the standings list "conference" records for independents. And finally, the college standings allow for ties, even though ties are no longer possible due to overtime rules which began in 1996. This is because ties exist in seasons prior to 1996.
The bottom of the team info screen lists the games currently included in the database, and the upcoming games on the schedule. The game list includes the game date, the score, the opponent's name, the game type, the opponent's power rating, the against the spread (ATS) game result (wins are printed in green, losses in red), and whether the point total went over or under. Most of this information is self explanatory, but the game type needs some explanation. Here is a brief description:
- Division Game - A game against a team from your own division and conference.
- Non-Division Conference Game - A game against a team from your conference that is not in your division.
- Non-Conference Game - A game against a team that is not in your conference or your division.
- Playoff Game - This is used to refer to all NBA playoff games (from the first round to the finals). In the NFL, it refers to all playoff games except the Super Bowl (designated as Super Bowl, of course). It is not used for college football.
College football bowl games are often designated by their common names. For example, Orange refers to the Orange Bowl. WinPicks does not always keep track of the corporate sponsorships. Conference championships also have their own designation. For example, MAC Title refers to the Mid American Conference championship game.
College basketball postseason tournament games (NCAA or NIT) are designated by the tournament name.
Pro Football Analyst (PFA) allows you to view the boxscore of any game by simply clicking the game score. This allows you to view the game stats for any game in the database.
The information on the team info screen is based on the database method currently in use. The games listed at the bottom of the screen are the games currently included in the database.
Viewing the Standings
WinPicks Reference Manual Section 7.2. Viewing the Standings
To view the standings, select STANDINGS from the VIEW menu. A screen appears showing the records of every team in the database. Select BY DIVISION to see the standings listed with each team grouped in divisions. Select BY CONFERENCE to see all of the teams in a conference listed as one group (Figure 7.20). Select BY LEAGUE to see every team listed in one group. Click a team's name to go directly to their TEAM INFO screen.
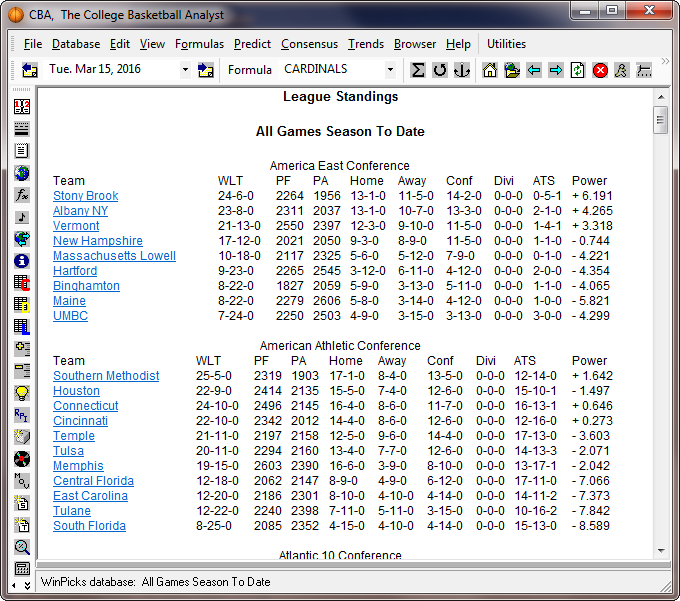
Figure 7.20 - The Conference Standings Screen (CBA)
Keep in mind that the standings are always printed for the database that is currently in use. For example, if a 3-game rolling average is used, the standings will only show the three most recent games for each team. To view the standings the way they are officially published, make sure the database is set to season to date.
Viewing Statistics with Pro Football Analyst
WinPicks Reference Manual Section 7.3. Viewing Statistics with Pro Football Analyst
All members of the WinPicks family allow you to view statistics by selecting STATISTICS from the VIEW menu. PFA includes all of the actual game statistics in its database, and allows you to view these statistics by team or by category. The databases of the other four packages only include the game scores and lines. The following sections explain the three ways to view statistics using PFA:
- By selecting a statistical category
- By selecting a team
- By displaying statistic charts
Viewing Stats by Category
You can view stats by category by selecting STATISTICS from the VIEW menu and then selecting BY CATEGORY. You'll see the menu shown in Figure 7.30.
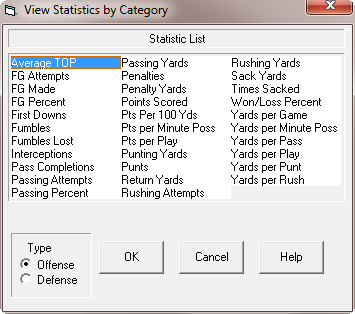
Figure 7.30 - The View Statistics by Category Menu (PFA only)
The menu lists the 32 statistical categories that you can view. Before selecting a category, use the Type box in the bottom left corner of the menu to choose between offensive and defensive stats. Keep in mind that a few stats ("Winning Percentage", for example) are identical for both offense and defense. After you select a category, all teams are listed in the order of their league ranking as shown in Figure 7.31. The name of the currently selected team is shown in capital letters. The two columns to the right of the team's name show the stat totals and the per game average.
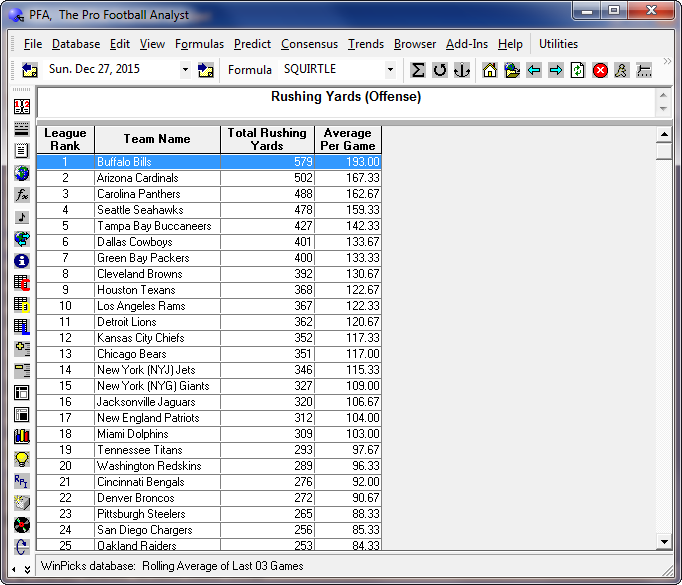
Figure 7.31 - Viewing a Statistic Report (PFA Only)
All stat reports are sortable by column. Clicking any column heading will sort the teams according to the information in that column. For example, click on TEAM NAME to sort the teams in alphabetical order (A to Z). Click it again to sort the teams in reverse order (Z to A).
Viewing Stats by Team
You can view stats by category by selecting STATISTICS from the VIEW menu and then selecting BY TEAM. A menu containing all of the NFL teams appears. When you select the team you want from this menu, you'll see a screen similar to the one shown in Figure 7.32.
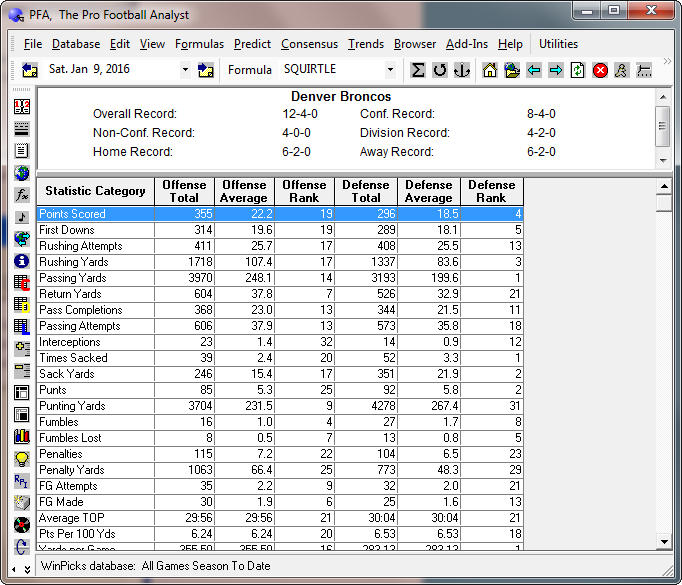
Figure 7.32 - Viewing a Team Report (PFA only)
The top part of this screen shows the team's overall won/loss record, their conference and non-conference record, and their record within the division. The rest of the screen shows the team's stats and league ranking in each offensive and defensive category. For example, a rank of 1 in the Points Scored category means that the team is the highest scoring team in the league. Keep in mind that the rankings are based on the database method currently in use. If a 3-game rolling average is in use, this means that the rankings are based on each team's performance in their 3 most recent games.
Viewing the Leaders Report
To view the top two and bottom two teams in every statistical category for both offense and defense, select LEADERS from the VIEW menu. You'll see a screen similar to the one shown in Figure 7.33. The defensive categories are listed below the offensive categories, so you will have to scroll down to view them. Keep in mind that the leaders reports is based on the database method currently in use. If a 3-game rolling average is in use, this means that the rankings are based on each team's performance in their 3 most recent games.
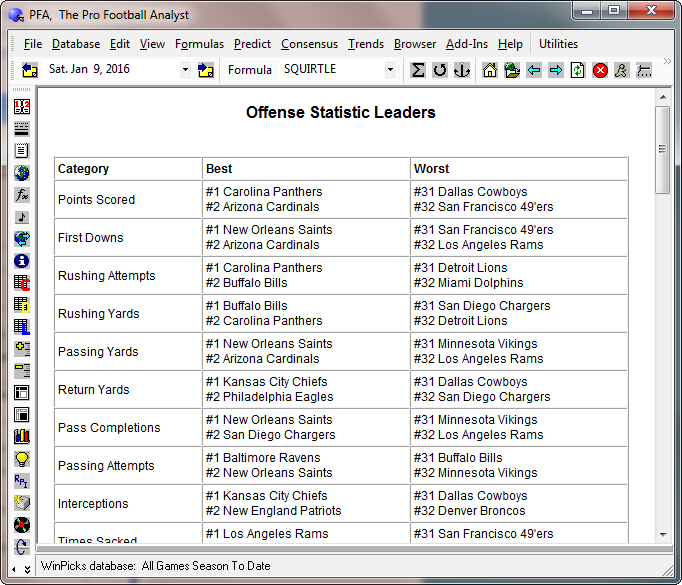
Figure 7.33 - The Leaders Report (PFA only)
Viewing the Yardage Rankings
This handy display allows you to quickly rank all of the teams based on their yardage gained/allowed statistics. To view the yardage rankings, select STATISTICS from the VIEW menu and then select YARDAGE RANKINGS. A display appears providing a quick summary of the league's best offensive and defensive teams. The handy three-column display ranks the teams in the order of yards gained, yards allowed, and yardage differential (yards gained minus yards allowed).
Viewing Stat Charts
One of the most powerful features of PFA is its ability to display statistic charts. There are three different ways you can use the CHARTS feature:
- When a team report is being displayed, select a statistic from the report. Double click with your mouse, or press ENTER after highlighting the statistic you want.
- When a statistics report is being displayed, select a team from the report. Double click with your mouse, or press ENTER after highlighting the team you want.
- Select STATISTICS from the VIEW menu and then select STAT CHARTS.
After you select STAT CHARTS, the CHARTS window appears as shown in Figure 7.33. The CHARTS window has two drop-down lists that let you change teams, or change the statistical category. This lets you chart the performance of any team, in any statistical category. A third drop-down list (on the right side of the window), lets you select the type of chart to display. There are five different types of charts:
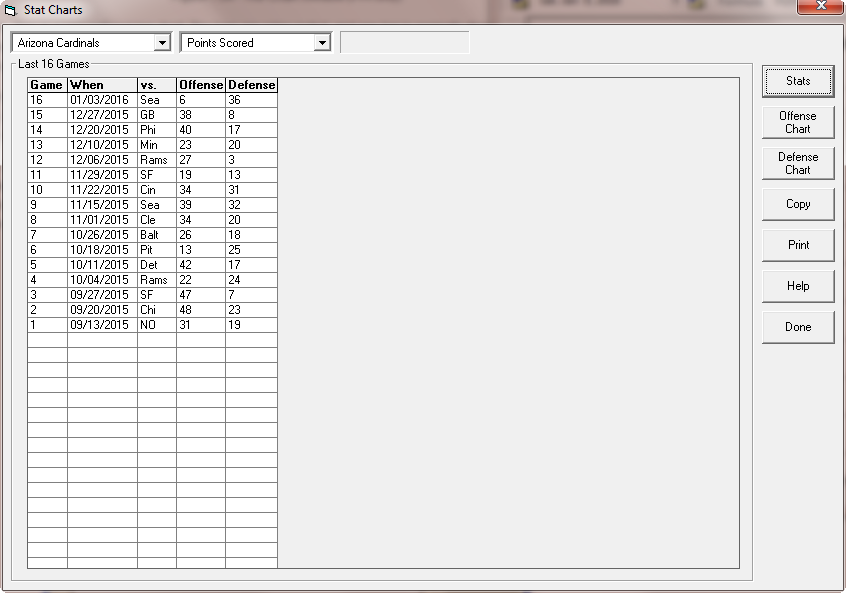
Figure 7.34 - The Chart Window (PFA only)
2D Bar Chart - This is a conventional bar chart. The bars are color-coded, and one bar is normally displayed for each game in the database. However, if a team did not register any statistics in the selected category for the game, no bar is present. In other words, if you produce an interception chart and there were no interceptions, there will not be a bar.
3D Bar Chart - This is also a conventional bar chart, but it is more elaborate than the 2D version. The bars are displayed in three dimensions, so you can see the top and side of the bar, in addition to its face. As with the 2D version, one bar is displayed for each game in the database.
Line Chart - This is a standard Cartesian graph, where each game represents one data point on the x-axis, and the statistics are plotted on the y-axis. A solid line is used to connect the data points. A dashed line shows the slope of the data after linear regression is performed. By looking at the slope of the dashed line (whether it goes up or down) you can tell if a team's performance is getting better or worse in the selected category. Figure 7.34 shows a sample line chart.
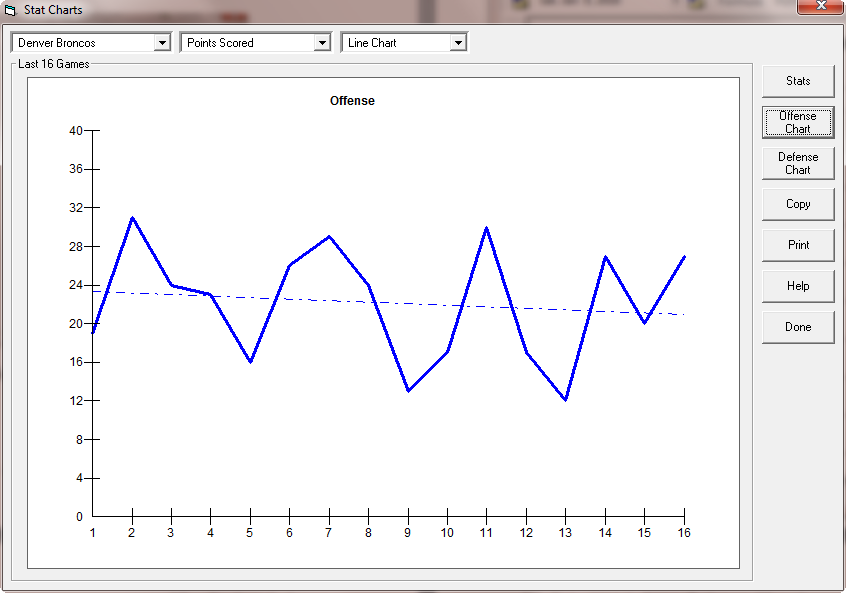
Figure 7.35 - A Sample Line Chart (PFA only)
Area Chart - This is similar to a line chart, except that the area under the line is filled in using a solid color. The data slope is not shown.
3D Pie Chart - This is a traditional pie chart, where each game represents one slice of the pie. A pie chart is useful for a small number of games (a 3-game roll, for example), but can be confusing if the number of games is too large.
You can display either offensive or defensive statistics, or display the data in a tabular format (instead of a chart). You may also copy a chart to the clipboard, or print the chart.
- Click the OFFENSE CHART button to view offensive statistics
- Click the DEFENSE CHART button to view defensive statistics
- Click the STATS button to display tabular data
- Click the COPY button to copy information to the clipboard
- Click the PRINT button to print
- Click the DONE button to exit CHARTS
Viewing CFA, CBA, PBA or PHA Statistics
WinPicks Reference Manual Section 7.5. Viewing CFA, CBA, PBA or PHA Statistics
CFA, CBA, PBA and PHA track only two game statistics, POINTS SCORED and POINTS ALLOWED. POINTS SCORED ranks each team according to the average number of points they have scored per game. POINTS ALLOWED ranks each team according to the number of points allowed per game.
POINTS SCORED and POINTS ALLOWED also show the average point totals for home and road games, as well as each team's record. To view this data, select STATISTICS from the VIEW MENU and then select either POINTS SCORED or POINTS ALLOWED.
Power Ratings
WinPicks Reference Manual Section 7.6. Power Ratings
WinPicks excels at generating power ratings. In fact, we use WinPicks to generate the MicroBrothers power ratings, which have been distributed through a number of electronic and print publications. To generate power ratings, select POWER RATINGS from the VIEW menu. You then have three options to choose from, as described in the following sections.
Current Formula
This option ranks all teams using the prediction formula and database that is currently in use. If you change formulas or use a different database, the power ratings will change.
When you select this option, you'll see a list of every team ranked according to their power rating. The average team has a power rating of 0. Above average teams have positive power ratings, below average teams have negative power ratings.
By subtracting one team's power rating from another, you can obtain the predicted point differential between the two teams. For example, if Team A has a power rating of 10, and Team B has a power rating of 6, your formula would predict Team A to defeat Team B by 4 points. The power ratings for both NFL and college football assume that the game is being played at a neutral site, and a home field advantage needs to be added or subtracted to obtain the final prediction. NBA teams receive two power ratings, one for their home performance, and one for their road performance. To project the point spread for a game, use the "Home Power" number for the home team, and the "Away Power" number for the road team.
Rating Percentage Index (RPI)
The Rating Percentage Index (RPI) is widely used to produce power ratings. It is best known for its use in college sports, where it plays a key role in the team selection for the NCAA basketball tournament, and for the NCAA football Bowl Alliance.
The RPI does not produce a point differential, but is still a useful handicapping tool. It essentially measures a team's strength of schedule and how a team does against that schedule. Unlike most power rating systems, the RPI does not consider margin of victory or how well a team has played. It only considers whether a team won or lost. In fact, the RPI is based entirely on winning percentage. It is based 25% on a team's winning percentage, 50% on the winning percentage of their opponents, and 25% on the winning percentage of their opponent's opponents.*
For example:
- Team A is 4-1 (win percentage = .800)
- Team A's opponents are 12-8 (win percentage = .600)
- Team A's opponent's opponents are 64-16 (win percentage = .800)
- RPI = (0.25 .800) + (0.5 .600) + (0.25 * .800)
- RPI = .200 + .300 + .200 = .700
The strength of schedule rating that WinPicks displays is based on the last two components of the RPI formula:
SOS = (2/3) Opponent's Winning Percentage + (1/3) Opponent's Opponents Winning Percentage
- When used for college sports, the RPI only counts games involving Division-1 opponents.
WinPicks weights away and home records differently when calculating winning percentages for the RPI. A road win is weighted as 1.4 when calculating the winning percentages, and a road loss is weighted as 0.6. Likewise, a home win is weighted as 0.6, and a home loss is weighted as 1.4. These adjustments apply to all percentages; e.g. a team's winning percentage, and their opponent's winning percentages.
The home/away rating weighting factors were added to WinPicks based on changes made to the RPI in December 2004 for college basketball. Previously all games were given the same weight, but historically, since home teams have won approximately two thirds of all games in college basketball, the RPI calculations were modified by the NCAAB committee. The WinPicks RPI rating has been adjusted to remain consistent with this change.
Several published versions of the RPI use slightly different ways to calculate the opponent's winning percentage. Therefore, the WinPicks RPI may not exactly agree with what you see in other places, but it should be very close. The exact RPI calculations in use by the NCAAB are difficult to verify. All published sources of the RPI rating we have found do not disclose the opponent winning percentages and the opponent's opponent winning percentages which were used to calculate the RPI rating, unlike WinPicks.
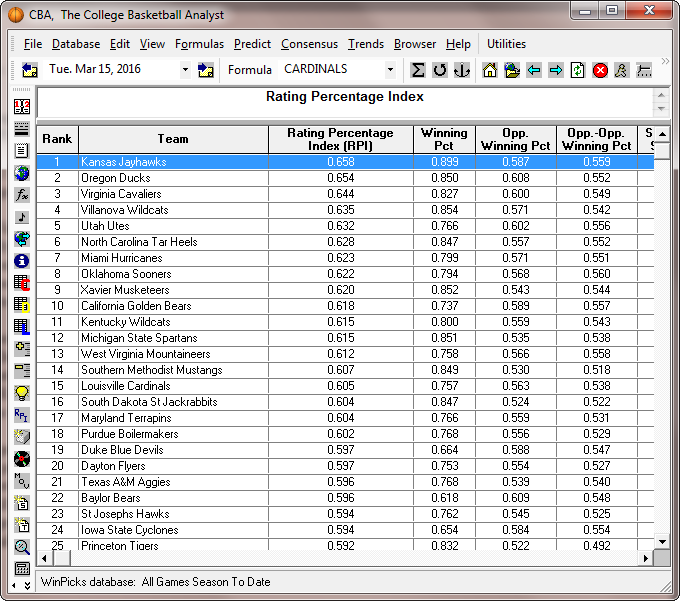
Figure 7.60 - Ratings Percentage Index (RPI) for CBA
Charts
This feature produces a grid containing each team's power rating during each week of the season. By looking at these numbers, you can tell if a team has been improving or getting worse as the season goes on.
Since it can be difficult to analyze a row of numbers, WinPicks can display a graph of the weekly power ratings. To display this graph, select CHARTS and then select a team from the alphabetical list.
A sample power ratings graph is shown in Figure 7.61. The graph is a standard Cartesian graph, with one data point for each game. The games are plotted on the x-axis, and the power ratings are plotted on the y-axis. A solid line connects the data points. A dashed line shows the slope of the data after linear regression is performed. By looking at the slope of the dashed line (whether it goes up or down) you can tell if a team is getting better or worse as the season goes on.
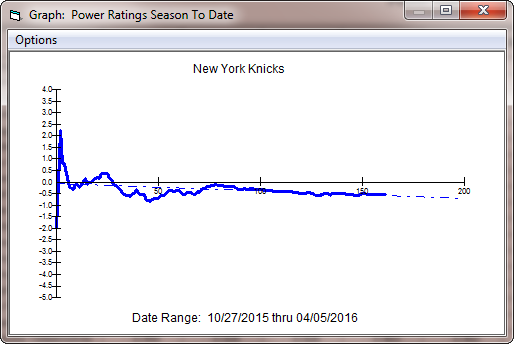
Figure 7.61 - A Sample Power Ratings Graph (PBA)
The power ratings graph has its own window with its own menu (called the OPTION menu). When you select this menu, you can print the graph, copy it to the clipboard, or exit.
Schedule Difficulty
WinPicks Reference Manual Section 7.7. Schedule Difficulty
All members of the WinPicks family can rank all teams according to their schedule difficulty. The team with the most difficult schedule is ranked first, and the team with the easiest schedule is ranked last. To use this option, select SCHEDULE DIFFICULTY from the VIEW menu.
Schedule difficulty is computed by taking the average power ranking of each team's opponents. When you change formulas or change the database method, the schedule difficulty rankings will also change.
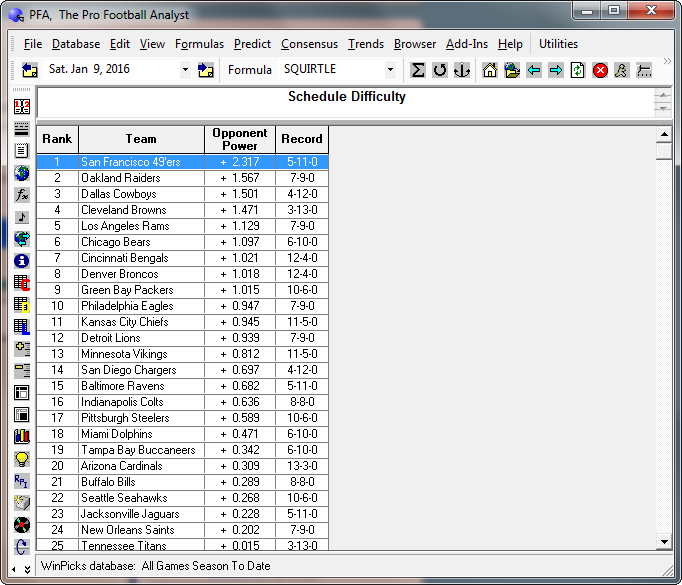
Figure 7.70 - Schedule Difficulty Rankings (PFA)
Records
WinPicks Reference Manual Section 7.8. Records
All members of the WinPicks family can rank teams according to their won-loss record. The records are based on the database method currently in use. If you use SEASON TO DATE as your database, the rankings will show what the league standings would look like if all of the teams were in the same division.
To use this option, select RECORDS from the VIEW menu. In addition to showing each team's straight-up record, this display also shows the home, away, and against the spread (ATS) record.
Inter-Conference and/or Inter-Division Records
WinPicks Reference Manual Section 7.9. Inter-Conference and/or Inter-Division Records
This option displays the won-loss record of a conference (college and pro football, college basketball) or division (pro basketball) when its teams play against teams from other conferences or divisions. To use this option select INTER CONFERENCE RECORDS or INTER DIVISION RECORDS from the VIEW menu.
This option is especially valuable for CFA and CBA users since it reveals the relative strengths of the conferences by showing how each conference collectively performs against teams from other conferences. Independent teams are grouped together and counted as a conference. Knowing how the conferences rank relative to each other will help you create successful prediction formulas using CFA or CBA.
This feature also keeps track of teams that change their conference affiliation. For example, Miami was an independent through the 1990 season. During that time, their won-loss record was added to the cumulative record for independents. They joined the Big East Conference in 1991, and their record in non-conference games from 1991 to 2003 was added to the cumulative record of the Big East Conference. In 2004, they joined the Atlantic Coast Conference, and their games are now added to the record of that conference.
Key Factors
WinPicks Reference Manual Section 7.10. Key Factors
There are four additional key handicapping factors you can view with PFA, three of which you can view with all versions of WinPicks. To do so, select KEY FACTORS from the VIEW menu. The "key" factors are described below.
Turnovers (PFA only)
This option shows you how the teams rank in the net turnovers department (Figure 7.100). This is a number that is often mentioned on the radio and TV broadcasts of NFL games. To get this number, you first count turnovers forced by counting the total number of times a team's defense has intercepted a pass or recovering a fumble. Then, turnovers allowed are counted by adding together the number of times a team's offense has thrown an interception or lost a fumble. Net Turnovers is obtained by turnovers allowed from turnovers forced. Most successful teams have a positive number for Net Turnovers so it is often a useful piece of handicapping information. The report also shows the average number of Net Turnovers per game, based on the database method currently in use.
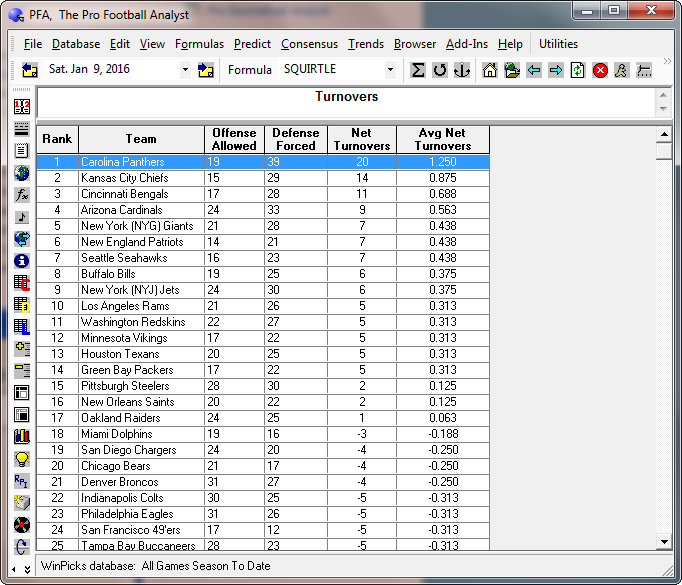
Figure 7.100 - The Turnovers Report (PFA Only)
Average Margin of Victory (all versions of WinPicks)
This option ranks all teams according to their average margin of victory (AMOV), based on the database method currently in use. The AMOV is computed by taking into account the final result of each team's games. For example, if a team has a record of 3-0, and has won the games by 4, 7, and 10 points respectively, their AMOV is +7 (21 points divided by 3). Teams that have been outscored by their opposition will have a negative AMOV. For example, a team with an 0-3 record that has lost by 4, 7, and 10 points will have an AMOV of -7. The AMOV is shown for all games, for home games, and for away games, and you can sort the rankings by clicking on the column headings.
Average Point Spread (all versions of WinPicks)
This option ranks all teams according to the average point spread in their games, based on the database method currently in use. The average point spread is computed from the closing lines for each team's games. A negative number in the "Avg Pt Spread" column means that a team is favored in their average game; a positive number means that a team is the underdog in their average game. This is a very useful feature that shows which teams get the most respect from the oddsmakers and the betting public. The average point spread is shown for all games, for home games, and for away games, and you can sort the rankings by clicking on the column headings.
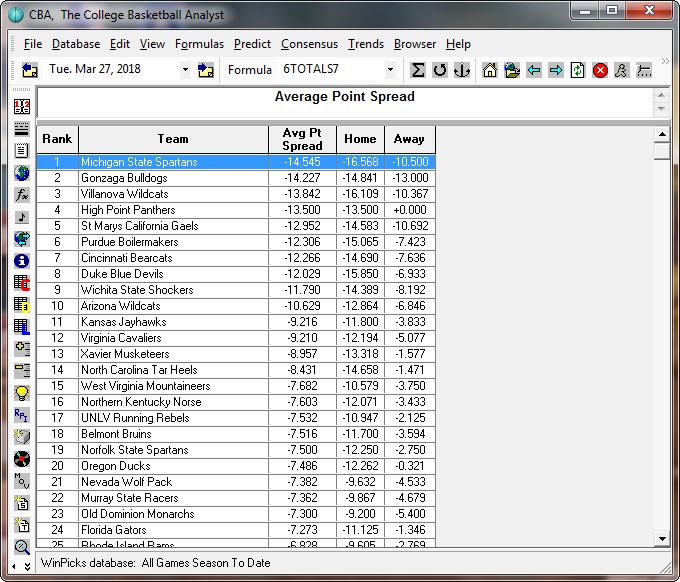
Figure 7.101 - The Average Point Spread Report (CBA)
Average Totals (all versions of WinPicks)
This option ranks all teams according to their average totals (over/under) line in their games, based on the database method currently in use. The average totals line is computed from the closing lines for each team's games. This is a very useful feature that shows which teams the oddsmakers expect to be involved in the highest or lowest scoring games. The average totals line is shown for all games, for home games, and for away games, and you can sort the rankings by clicking on the column headings.
Viewing Non Division-1 Teams (CFA and CBA)
WinPicks Reference Manual Section 7.11. Viewing Non Division-1 Teams (CFA and CBA)
CFA and CBA each include an interesting feature for aficionados of college sports. This feature allows you to see the results of games where a Division-1 team played a non Division-1 team. To use this feature, select NON DIVISION-1 TEAMS from the VIEW menu. A list of non Division-1 teams will appear. When you select a team from this list, all of its games against Division-1 opponents are listed, and the display also shows a team's overall won-loss record against Division-1 teams.
Games involving non Division-1 teams usually occur early in the season. The games are usually one-sided, but in rare instances the non Division-1 team will stay close or even win. This feature provides some useful historical information if one of the smaller schools shows up on your favorite team's schedule
Viewing Stadium and Arena Information
WinPicks Reference Manual Section 7.12. Viewing Stadium and Arena Information
All members of the WinPicks family can display information about the stadium or arena where each team plays its home games. To use this option, select STADIUMS/ARENAS from the VIEW menu.
All versions of WinPicks display the name of the facility, the city and state where it is located, and the seating capacity. PFA also displays the type of facility (open, dome, or retractable dome), and the type of playing surface (natural or artificial). The list of facilities is sorted by team name.
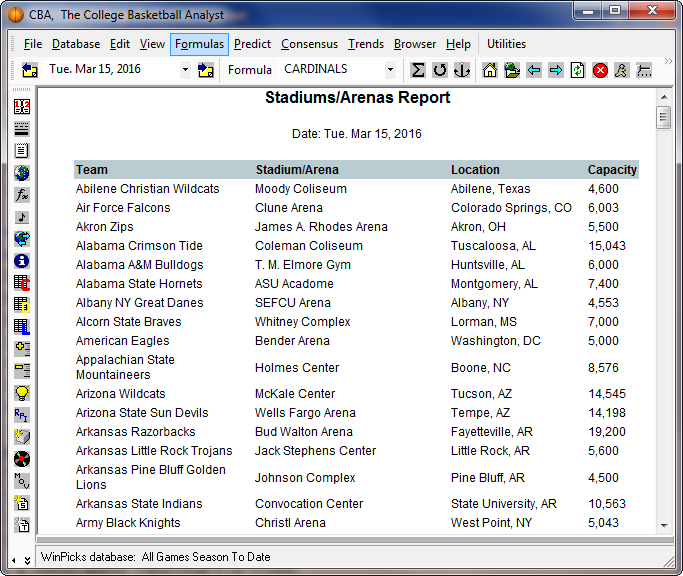
Figure 7.120 - The Stadiums/Arenas Report (CBA)
The Weather Board and the Weather Lab (Pro Football Analyst)
Pro Football Analyst is the one package whose games are played in weather, and WinPicks 2.0 treats the weather as data: recorded conditions, game by game, and two screens that read them. Both are part of Pro Football Analyst only.
The Weather Board. Choose Database > Weather Board. The screen is shown in Figure 7.130.
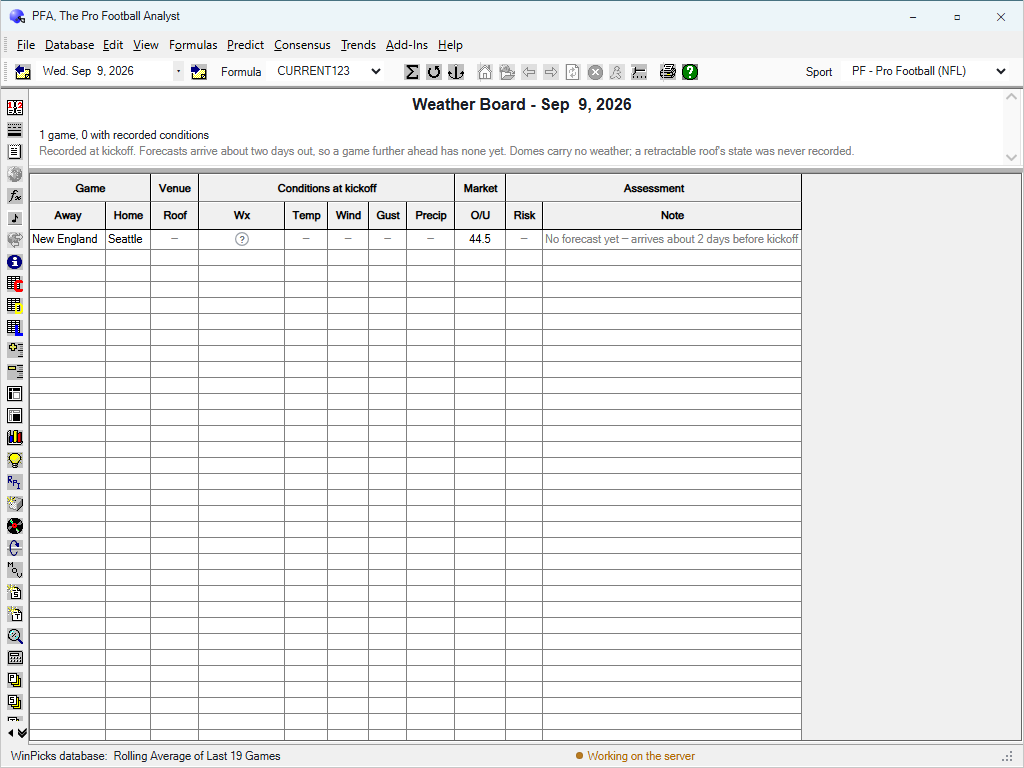
Figure 7.130 - The Weather Board (PFA)
The Board lists every game on the date you are browsing, one row each, under grouped headings: Game (away and home teams), Venue (the roof state), Conditions at kickoff (Wx - the sky - then temperature, wind, gusts, and whether precipitation fell), Market (the totals line), and Assessment (a Risk flag, and a Note saying in words why a game deserves a second look - or why there is nothing to show). The counter above the grid says how many of the date's games have recorded conditions.
The conditions are recorded at kickoff for played games; for a coming game the forecast arrives about two days out, and until then the row says so - as the game in Figure 7.130 does - rather than showing a guess. Domes carry no weather, and a retractable roof's state is not recorded. The Board sits on the Database menu for the same reason Stadiums/Arenas sits on the View menu: it reports what the conditions are, not what to do about them.
The Weather Lab. Choose Add-Ins > Weather Lab. Where the Board reports one date, the Lab asks the standing question - it is printed under the title in Figure 7.131: does weather beat the betting line?
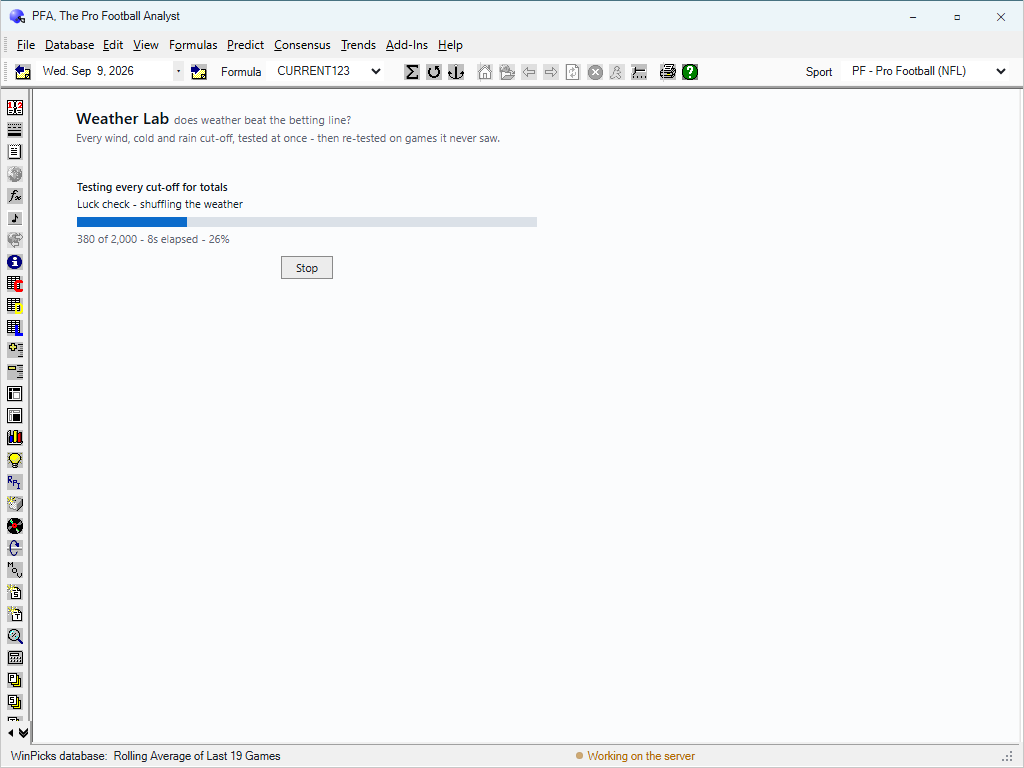
Figure 7.131 - The Weather Lab Running Its Sweep (PFA)
The unit is points against the market, and that choice is the method. Everyone knows wind lowers scoring; so do the oddsmakers, and a windy game gets a lower total to start with. A measurement of raw scoring would "discover" that fact endlessly and profit from it never. The Lab therefore grades every effect in points against the posted number: how far the actual result beat or missed the total (or the spread) that was on offer. An effect the market has already priced in reads as zero, however dramatic the weather was - only the part the number missed counts.
What a run does. Press nothing: the Lab tests every cut-off at once - wind at each threshold, gusts, cold, heat, rain, crosswind, snow - for totals or for sides, over every game with recorded conditions. It does not ask you to nominate a theory first, because nominating the theory after seeing the data is the oldest trick a handicapper plays on himself; instead it runs the whole family and then asks, honestly, whether the best of the family means anything.
The luck check is the slow part, and the point. The progress line in Figure 7.131 is worth reading: "Luck check - shuffling the weather, 380 of 2,000". Testing every cut-off takes seconds. What takes minutes is re-running that entire search two thousand times with the weather shuffled against the games - to learn what the best cut-off of a whole family looks like when weather means nothing at all. The strongest of many tries is always impressive; the shuffles measure how impressive it is by accident. The result is the Luck Meter: not a pass or fail light, but a distance - how far your finding stands from the best that pure chance produced.
Blind test first. When the run finishes, the screen opens on one sentence stating the strongest finding - and the finding that leads is always the blind-test result, measured on games the search never saw, never the hindsight number. Click through and the working unfolds in layers: a curve across every cut-off, and behind a "Full numbers" expander, the complete statistics. Nothing is removed for the plain view, only deferred.
Reading the curve. The curve is the test a headline cannot fake. A real physical effect grows with its cause: if wind suppresses scoring beyond what the market priced, the effect should deepen as the cut-off climbs from 10 to 15 to 20 miles per hour - a gradient down the axis. A lucky cut looks different: flat nothing, one spike at a single threshold, flat nothing. The spike is the winner of the family competition; the gradient is a finding.
Saving. A finding you want to follow is saved with Save as System, where it is graded from that day forward on games the search never touched (see My Systems, in section 9). The button is deliberately not called "add to picks": a recommendation is exactly the claim this screen exists to avoid making.
What weather does not predict. Honesty about the limits is part of the method, and the program's own measurements supply it. First: most of what weather does to scoring is already in the number, so most cut-offs read near zero - that is the market working, not the Lab failing. Second: a strong in-sample cut-off can be an era in disguise. The league's own over rate drifts - it ran 45.4% across 2021-23 and 52.5% across 2024-25 - so any weather filter whose games bunch into one era inherits that drift and looks like a discovery. The program's measured example is exactly this shape: wind over 10 miles per hour scored z -5.30 against a coin on 2021-23 totals, a seemingly overwhelming effect - but only -4.08 against the same games' baseline, and on the held-out 2024-25 seasons, -0.66. The Lab's blind-first layout, the shuffled-weather Luck Meter and the vs-rest comparison in the Trend Finder all exist because of results like that one. Treat any weather finding that has not survived a blind test as a hypothesis about the past, not an edge in the future.
Weather in the Trend Finder. The same recorded conditions are filters in the Trend Finder - wind, temperature, rain or snow - with dome games neutralised so that indoor teams can never produce a cold-weather trend by mistake. See Trend Finder, in section 9.