WinPicks Reference Manual
Section 8.10. Making Detailed Predictions
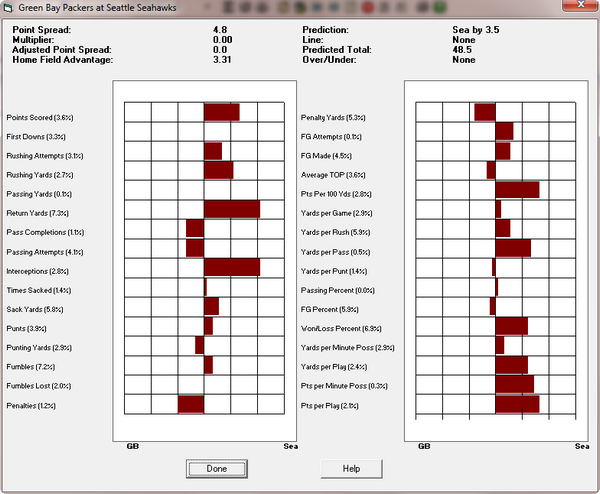
WinPicks can show you how predictions are made by displaying a summary of game information. This summary includes the predicted outcome, the line, the projected point total, and a bar graph (PFA only) that illustrates how the two teams match up statistically. To use this feature, select SIDES or TOTALS and then click on "details" next to one of the games on the list. The detailed prediction window (PFA version) appears as shown in Figure 8.100.

Figure 8.100 - The Detailed Prediction Window (PFA)
The detailed prediction window for PFA compares the teams in 32 different statistical categories. This information is displayed using a bar graph. The bar for each statistic points toward the team with the advantage. The longer the bar, the greater the advantage. If no bar is shown for a given statistic, then the two teams are considered equal in that category. Dark colored bars are used for statistics included in the prediction formula. Light colored bars are used for statistics that are not included (percentage weight equals 0).
The percentage weights in the formula are used to obtain a point spread. This initial Point Spread is shown at the top of the window. This point spread is then multiplied by the formula's Point Spread Multiplier to get the Adjusted Point Spread. Then, the Home Field Advantage is added to obtain the final prediction for the game. For example, the initial Point Spread might be 3.1. If the Point Spread Multiplier is set to 0.8, the Adjusted Point Spread is 2.48 points (3.1 x 0.8). If the HFA is 2.5 points, the home team is predicted to win by 4.98 points (2.48 + 2.5). This number is rounded to the nearest half point, so PFA predicts that the home team will win by 5 points. The prediction is shown in the top right corner of the window along with the line for the game, and the projected point total.
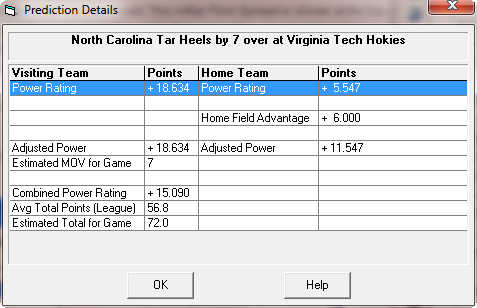
The detailed prediction windows for CFA and PBA display the prediction information in tabular form (no bar graph) as shown in Figure 8.101.

Figure 8.101 - The Detailed Prediction Window (CFA)


