Analyzing Trends
WinPicks Reference Manual Section 9. Analyzing Trends
WinPicks lets you check the performance history of any team. It can show you how a given team (or an entire conference or league) has performed in thousands of different situations. You can go as far back as your database allows. The size of the database varies from product to product, as listed below:
- Pro Football Analyst (PFA) - The database includes all games from the 1985-86 NFL season through the current season.
- College Football Analyst (CFA) - The database includes all games from the 1985-86 NCAA season through the current season.
- Pro Basketball Analyst (PBA) - The database includes all games from the 1990-91 NBA season through the current season.
- College Basketball Analyst (CBA) - The database includes all games from the 2000-01 NCAA season through the current season.
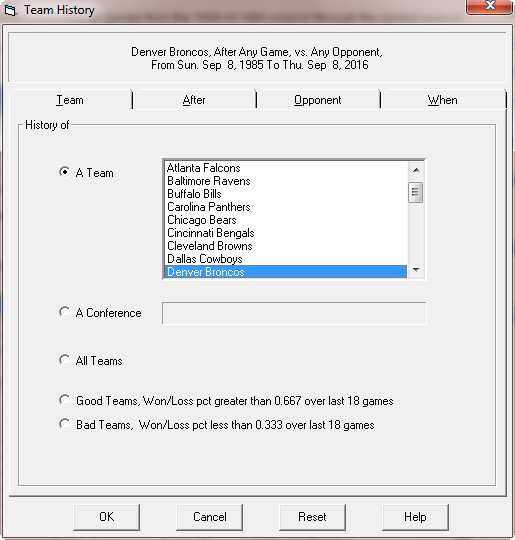
Figure 9.00 - The Team History Window (PFA)
The TRENDS menu is shorter in WinPicks 2.0 than the one this section was written against. Trend Finder, described below, is the front door for trend questions; Trend Seeker, My Systems, My Trends, the Watch Lists and the alerts are on the menu as before. Team History, Situation Analysis and Key Trends are no longer menu items, but their screens are unchanged and their toolbar buttons still open them.
This section covers the following topics:
- 9.1 - Finding Trends Manually using Team History
- 9.2 - Displaying and Saving Trends using Team History
- 9.3 - Finding Trends Automatically using Trend Seeker
- Trend Finder
- My Systems
- 9.4 - Viewing Trends using the Trend Seeker Watch List or My Trends
- 9.5 - Using Trends to Generate Alerts
- 9.6 - Situation Analysis
- 9.7 - The Key Trends Report
- 9.8 - Statistically Significant Trends
- 9.9 - This Week's Edges
Finding Trends Manually using Team History
WinPicks Reference Manual Section 9.1. Finding Trends Manually Using Team History
To open Team History, click its button on the toolbar. The team history window allows you to set four different parameters (TEAM, AFTER, OPPONENT and WHEN). Each parameter is represented by an "index card". When you select the file tab of one of the "index cards", you can modify the parameter and customize TEAM HISTORY so that it only includes the games that you are interested in.
Whenever you change a parameter, the text at the top of the team history window is modified so that it describes which games are now being included in the team history. For example, PBA users could customize TEAM HISTORY so that the heading looks like this:
Denver Nuggets, After Losing ATS 3 or More Games, vs. Conference Opponents, When Playing on Thursday
As you can see from this heading, the number of trends you can look for is almost limitless. The four parameters you can modify are explained in the sections below.
Team
The TEAM parameter allows you to select the team(s) that you wish to include in the team history. You may select one of the following five options:
- A Team - This is the most commonly selected option. After selecting this option, you are required to select a team from the menu (teams are listed alphabetically). PFA users may select any NFL team, PBA users may select any NBA team, and CFA and CBA users may select any Division-1 college team.
- A Conference - After selecting this option, you are required to select a conference or division from the menu (listed alphabetically). PFA users may select any NFL division or conference, PBA users may select any NBA division or conference, and CFA and CBA users may select any Division-1 division or conference.
- All Teams - When you select this option, you select all of the teams tracked by WinPicks. For example, PFA users select all NFL teams, PBA users select all NBA teams, and CFA and CBA users select all Division-1 college teams.
- Good Teams - When you select this option, you select teams that have done well in recent games. By default, a good team is defined as one with a winning percentage of better than 66.7 percent in a number of games approximately equal to one season. However, you can define the settings by selecting Set Trend Options.
- Bad Teams - When you select this option, you select teams that have done poorly in recent games. By default, a bad team is defined as one with a winning percentage of less than 33.3 percent in a number of games approximately equal to one season. However, you can define the settings by selecting Set Trend Options.
After
This parameter is extremely powerful. It allows you to limit the team history to games that took place after a specified condition. There are six different selectable categories. Each category has two possible choices, or you can deselect both choices to ignore the category completely, as shown in Figure 9.10. Every possible combination can use the number of games that you select, up to a maximum of 10 games.
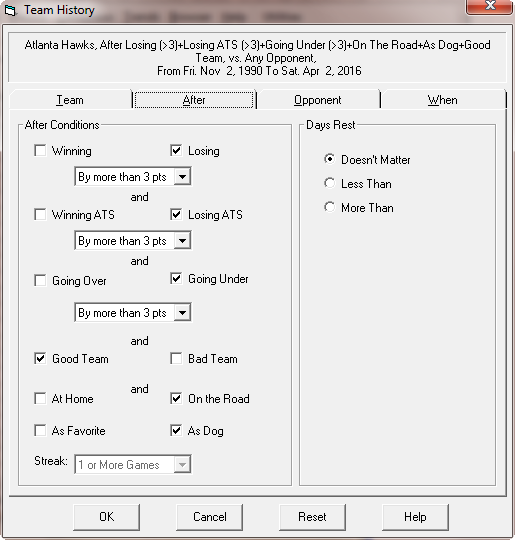
Figure 9.10 - Selecting the After Conditions (PBA)
The six categories are:
- Winning & Losing - Winning only includes games where the selected team(s) was playing after a win. You can select the number of games (from 1 or more to 10 or more). For example, if you select "3 or more games" the team history only includes games where the selected team(s) was playing after having won three or more consecutive games. Losing works the same way, except that it only includes games where the selected team(s) was playing after a loss.
- Winning ATS & Losing ATS - Winning ATS only includes games where the selected team(s) was playing after a game where they covered the point spread. You can select the number of games (from 1 or more to 10 or more). For example, if you select "3 or more games" the team history only includes games where the selected team(s) was playing after covering the spread in three or more consecutive games. Losing ATS works the same way, except that it only includes games where the selected team(s) was playing after failing to cover the point spread.
- Going Over & Going Under - Going Over only includes games where the selected team(s) was playing after a game where the combined point total went "over" the totals line. You can select any number of games (from 1 or more to 10 or more). For example, if you select "3 or more games" the team history only includes games where the selected team(s) was playing after having gone "over" the projected total in three or more consecutive games. Going Under works the same way, except that it only includes games where the selected team(s) was playing after a game where the combined point total was under the totals line.
- Good Team & Bad Team - By default, Good Team only includes games where the selected team(s) was playing after playing a team with a winning percentage of 66.67 percent or higher in recent games. Bad Team only includes games where the selected team(s) was playing after playing a team with a recent winning percentage of less than 33.33 percent. To change these settings, select Set Trend Options.
- On the Road & At Home - On the Road only includes games where the selected team(s) was playing after a road game. You can select the number of games (from 1 or more to 10 or more). For example, if you select "3 or more games" the team history only includes games where the selected team(s) was playing after having been on the road for three or more consecutive games. At Home works the same way, but only includes games where the selected team(s) was playing after a home game.
- As Favorite & As Dog - As Favorite only includes games where the selected team(s) was playing after a game where they were favored. You can select any number of games (from 1 or more to 10 or more). For example, if you select "3 or more games" the team history only includes games where the selected team(s) was playing after having been favored in three or more consecutive games. As Dog works the same way, except that it only includes games where the selected team(s) was playing after a game where they had been the underdog.
You are allowed to customize the team history further by using the "Days Rest" feature. There are three "Days Rest" options that you can choose from:
- Doesn't Matter - Doesn't Matter is the default setting. It includes all games.
- Less Than & More Than - These two settings allow you to include games where the selected team was playing after "less than" or "more than" a specific amount of rest. You can set the amount of rest to an interval of from 1 to 20 days. This feature is especially useful when looking for NBA trends.
Opponent
The Opponent setting lets you limit the team history to games where the selected team(s) was playing against a selected opponent or group of opponents. All members of the WinPicks family allow you to select from any one of the following Opponent options:
- Any Opponent - Includes all games against all opponents.
- Regular Season Opponents - Includes all games except for postseason games. WinPicks does not track preseason games.
- Post-Season Opponents - Includes postseason games only.
- Division Opponents - Includes all games against teams in the same division.
- Conference Opponents - Includes all games against teams in the same conference.
- Non-Conference Opponents - Includes all games against teams in other conferences.
- Home Opponents - Includes all games played at home.
- Away Opponents - Includes all games played on the road.
- Good Team Opponents - Includes all games against good teams as defined by Set Trend Options.
- Bad Team Opponents - Includes all games against bad teams as defined by Set Trend Options.
- vs. Specific Team - Includes all games against a specific team that you select.
- vs. Specific Conference - Includes all games against a specific conference or division that you select.
- Exact Line Value - Includes all games when the line was set to the specified value. For example, selecting 7 will show all games when the line was set to 7 points.
Pro Football Analyst (PFA) also allows you to see how a team has performed in specific types of stadiums. This option is not available in the other versions of WinPicks. There are three stadium types you may select from:
- Dome
- Open Natural Surface
- Open Artificial Surface
When
The When setting allows you to limit the team history to only include games where the selected team(s) was playing at a specific time as shown in Figure 9.11.
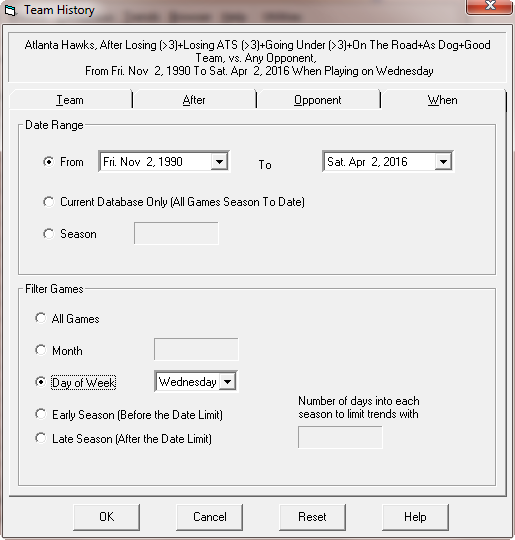
Figure 9.11 - Selecting the When Conditions (PFA)
All versions of WinPicks allow you to select a date range and filter options from the When screen. The date range allows you to choose from the following settings:
- From - Allows you to pick a starting date and end date. The default settings use the first date in the database as the start date, and the current date as the end date.
- Current Database Only - Only includes games from the current database. For example, if a 3-game rolling average is in use, the team history only includes the 3 most recent games played by the selected team(s).
- Season - Includes games from the selected season.
The filter settings allow to filter out the games you want from the selected date range:
- All games - Includes all games from the selected date range.
- Month - Only includes games from the selected month.
- Day of Week - Only includes games from the selected day of week. This feature's most common application is finding trends relating to Monday Night NFL games or Thursday night college football games. However, it is also quite valuable when handicapping NBA games, since many teams follow strong day of week trends.
- Early Season or Late Season - This option allows you to only include games early in the season or late in the season, using a day number that you specify. For example, if you select "Early Season" and set the day setting to 50, the team history will be limited to games played before the season was 50 days old.
After all team history parameters have been set:
- Click the OK button to view the team history
- Click the CANCEL button to quit
- Click the RESET button to reset all parameters
More Information about Querying the Database with Team History
TEAM HISTORY is extremely powerful and quite easy to use. It allows you to query the database and locate just about any imaginable trend. To give you a better idea of its power, here are a few sample questions you can answer in seconds using TEAM HISTORY (use RESET to reset the parameters before beginning a new query):
Q. How often do NFL home dogs cover on Monday night?
A. You can answer this question with PFA. Use TEAM to select "All Teams". Use WHEN to set Day of Week to Monday. To find the answer, look at the ATS record for home dogs.
Q. How often do away dogs win in dome stadiums?
A. Another question for PFA. Use TEAM to select "All Teams". Use OPPONENT to set Stadiums to "Dome". To find the answer, look at the SUR record for away dogs.
Q. How often do the Chicago Bulls cover after two or more losses?
A. A question for PBA. Use TEAM to select "A Team" and then select the Chicago Bulls. Use AFTER to select "Losing", and then select "2 or More Games". To find the answer, look at the ATS record for all games.
Q. How well do college football teams do ATS after failing to cover in 5 or more consecutive games?
A. A question for CFA. Use TEAM to select "All Teams". Use AFTER to set LOSING ATS to "5 or More Games". To find the answer, look at the ATS record for all games.
Q. How well do college basketball teams do ATS when playing at home after losing 3 or more consecutive games during the first 30 days of the season?
A. A question for CBA. Use TEAM to select "All Teams". Use AFTER to set "Losing" to 3 or more games. Use WHEN to set "Early Season" with a 30 day limit. To find the answer, look at the ATS record for home games.
Q. How well do Big 10 basketball teams do against the spread when playing a home conference game during the month of January after three or more consecutive losses?
A. A question for CBA. Use TEAM to select the Big 10 Conference. Use AFTER to set "Losing" to 3 or more games. Use WHEN to set the month to January. To find the answer, look at the ATS record for home games.
Q. How well does Notre Dame do in football against the spread after winning 5 or more consecutive games during the month of October?
A. A question for CFA. Use TEAM to select Notre Dame. Use AFTER to set "Winning" to 5 or more games. Use WHEN to set the month to October. To find the answer, look at the ATS record for all games.
Displaying and Saving Trends using Team History
WinPicks Reference Manual Section 9.2. Displaying and Saving Trends Using Team History
The team history display shows the performance history for the selected team(s). A sample screen is shown in Figure 9.20:
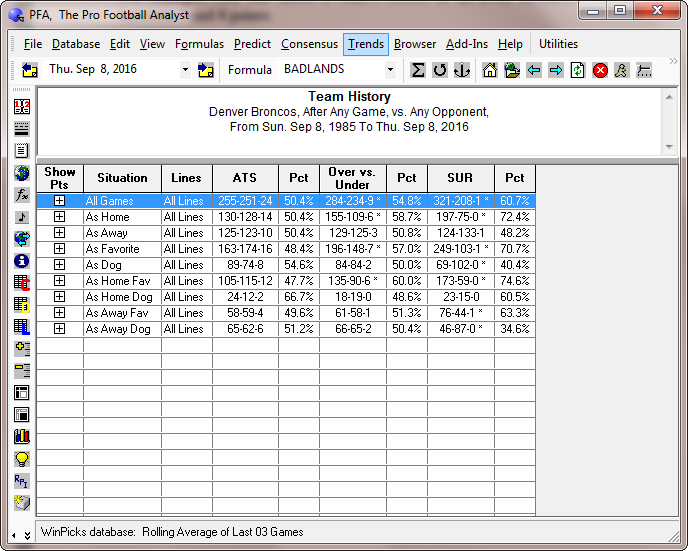
Figure 9.20 - Viewing a Team History (PFA)
The title at the top of this screen explains which data has been included in the team history. This data is further broken down into nine situations, with each situation having its own line on the grid:
- All Games
- As Home
- As Away
- As Favorite
- As Dog
- As Home Favorite
- As Home Dog
- As Away Favorite
- As Away Dog
The screen shows how the selected team(s) has fared in each situation by listing their against the spread record (ATS), their over/under record (Over vs. Under), and their straight-up record (SUR). The winning percentage in each situation is also shown (Pct). Records that show a statistically significant trend are marked with an asterisk. Keep in mind that some situations will not contain any games. For example, if you have customized team history to only include home games, all situations involving road games (Away, Away Favorite, and Away Dog) will remain blank.
The leftmost column of the TEAM HISTORY screen (Show Pts) contains a small white box with a plus sign (+) inside. If you click on this box, the plus sign becomes a minus (-) sign. At this point, the window expands, and the situation is broken down further based on the size of the point spread. This allows you to quickly research trends that would be nearly impossible to find anywhere else. For example, you can check a team's record as an away favorite when the point spread was between 3 and 6 points.
If you select any situation in the TEAM HISTORY grid, the history viewer window appears (Figure 9.21). The window title shows which options have been selected. It also shows the average points scored and allowed in this situation, and the average margin of victory (MOV). This window contains a list of games that match your selection criteria. It shows the game date, the team names, score, line, and totals line (Total) for each game (if numbers are available). The ATS column indicates whether the selected team covered against the spread (WON), or failed to cover (LOST). The OU column indicates whether the game went over or under the totals line. The folders on the left side of the window allow you to select past games or future games, so you can find upcoming games on the schedule that match this trend. If you right click the mouse button on any game in the history window, a window appears showing the previous game result.
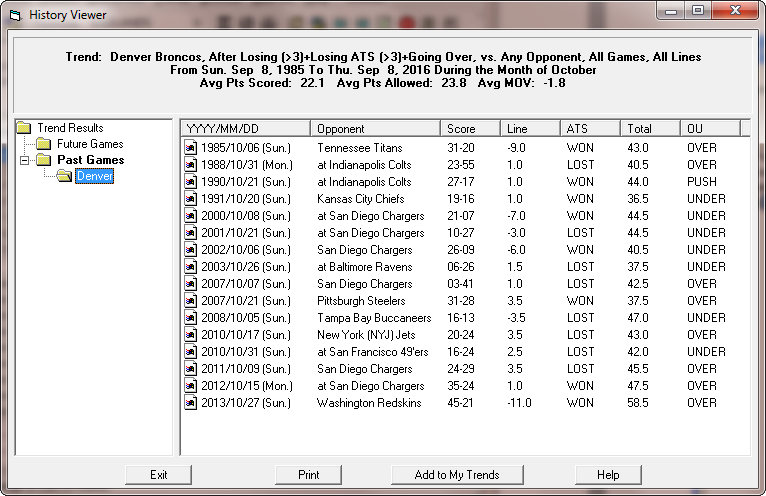
Figure 9.21 - The History Viewer Window (PFA)
Saving a Trend
You can save any trend that you find to a list of your own personal trends that you want to follow in the future. This feature is known as MY TRENDS. To add a trend to MY TRENDS, simply click on the ADD TO MY TRENDS button shown in Figure 9.21. Note that you can only save an ATS or an O/U trend with MY TRENDS, trends relating to SUR cannot be saved. However, conference trends can be saved as well as team trends. Once you add a trend to MY TRENDS, you'll be able to view it again later, or use it to generate a trend alert.
Finding Trends Automatically using Trend Seeker
WinPicks Reference Manual Section 9.3. Finding Trends Automatically Using Trend Seeker
WinPicks has many features to help you find significant trend information, including Team History, Situation Analysis, and Key Trends.
Trend Seeker goes one step beyond the other features by searching through multiple combinations of game conditions to find significant trend patterns in the database. And best of all, it will alert you when the trends it finds match games yet to be played.
On the TRENDS menu it is listed as TREND SEEKER (CLASSIC). The word marks it as the original sweep, to tell it from the Trend Finder beside it; nothing about what it does has changed.
Trend Seeker is built upon three key features listed in the table:
| Feature | Function |
|---|---|
| Trend Seeker | Searches through past games and compiles a list of significant trends. |
| Trend Seeker Watch Lists | Displays the most recent list of significant trends that Seeker found. |
| Trend Seeker Alerts | Scans upcoming games against the Watch List, and produces a detailed report of all games that match. |
| You can expect to find more trends using Trend Watch than you could manually using the other WinPicks features. However, you should become familiar with Team History before using Trend Watch in order to understand all of the data. | Trend Seeker |
Seeker does exactly what its name implies. It seeks out significant trends using a range of game dates and conditions you select. It saves all of the significant trends it finds to the Watch List. Select "Trend Watch", then "Seeker" from the TRENDS menu, and the following window will be displayed:
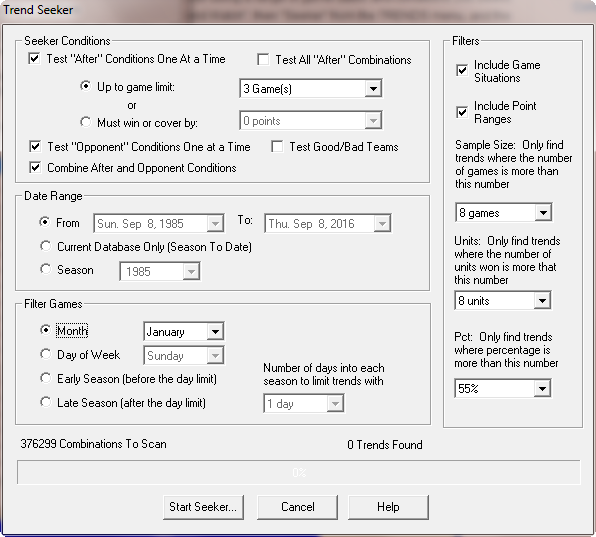
Figure 9.30 - The Trend Seeker Window (CFA)
You can control what conditions Seeker will look for by selecting different options in the Seeker window.
Seeker Conditions
Test After Conditions One At A Time
Checking this box will cause Seeker to look for trends using all of the possible "After Playing" conditions in Team History. These conditions include:
- After Any Game
- After Winning
- After Losing
- After Winning ATS
- After Losing ATS
- After On The Road
- After At Home
- After Over
- After Under
If you select "Test After Conditions One At A Time", Seeker will try each condition one at a time. This is the default setting, and will identify many significant trends.
Test All After Combinations
If you select "Test All After Combinations", Seeker will combine the individual After conditions together. There are 191 unique combinations of After conditions tested. Using "Test All After Combinations" takes much longer to run than testing with just one at a time. However, Seeker will find trends like "After Winning+After Winning ATS +After On The Road+After Going Over" if you run it this way.
You can also change how many games to include in the "After" search. This is set using the "Up To:" list. The "Up To" list allows searches from 1 to 10 games back. For instance, if you check "Test All After Conditions One At A Time", and then set the "Up To" value to 3 games, Seeker will search for trends "After Winning 1 Game", "After Winning 2 Games", and "After Winning 3 Games". It repeats this process for all of the "After" conditions listed above.
Test Opponent Conditions One At A Time
Checking this box will cause Seeker to look for trends using most of the "Opponent" conditions listed in Team History. These include:
- Any Opponent
- Post Season Opponents
- Division Opponents
- Conference Opponents
- Non-Conference Opponents
- Head to Head Matchups
- Stadium (PFA only)
Combine After and Opponent Conditions Together
The Combine After and Opponent Conditions Together option tells Seeker to look at all "After" conditions and "Opponent" conditions together when searching for trends. If it is turned off, then Seeker only varies one condition at a time. For instance, suppose you have selected both the "Test All After Conditions One At A Time" and the "Test All Opponent Conditions One At A Time" conditions in your search. Seeker will start searching each "After" condition, but with the next opponent always set to "Any Opponent". It will then search each "Opponent" condition, but with the after condition always set to "After Any Game."
If "Combine After And Opponent Conditions Together" is turned on, Seeker combines both the "After" and "Opponent" conditions for a comprehensive trend search. Using the example above, it would try "After Winning" against every "Opponent" condition, then "After Losing" against every "Opponent" condition, and so forth until every possible combination has been searched for and found.
Test Good/Bad Teams
This option tells Seeker to search for trends involving good teams or bad teams as defined by Set Trend Options.
Date Range and Filter Games Options
The games that Trend Seeker will search are selected here. Seeker uses the same database options as the When feature of Team History. Refer to the Team History section for a description of each setting.
Filters
The Seeker filters let you limit the game situations to search. "Include Game Situations" tells Seeker to check all of the home/away and favorite/underdog trends. This is the default setting. If disabled, the fewer trends will be found, but Seeker will run quicker.
"Include Point Ranges" is also the default setting, and tells Seeker to try each of the point ranges in Team History when searching for trends. If you turn it off, only trends which are significant for any point range value are saved.
Start Seeker
The "Start Seeker" button begins the search. When you click "Start Seeker", the progress bar shows how long the search will take. In addition, the number of statistically significant trends that Seeker finds is updated on the window next to the total number of combinations Seeker will try. You can exit Seeker at any time by clicking the "Cancel" button. When the search is finished, Seeker saves the data to the Watch List.
A final note about Seeker - you may recall in Team History that you can search trends for any team, a conference, or all teams. Seeker will perform searches on each team individually, and then for all teams in the league. However, Seeker does not attempt to find trends for each conference.
Trend Finder
Trend Seeker, described in the previous section, sweeps the database and hands you the trends it finds. Trend Finder does the opposite: you ask a question, and it answers that one. Choose Trends > Trend Finder. The screen is shown in Figure 9.35.
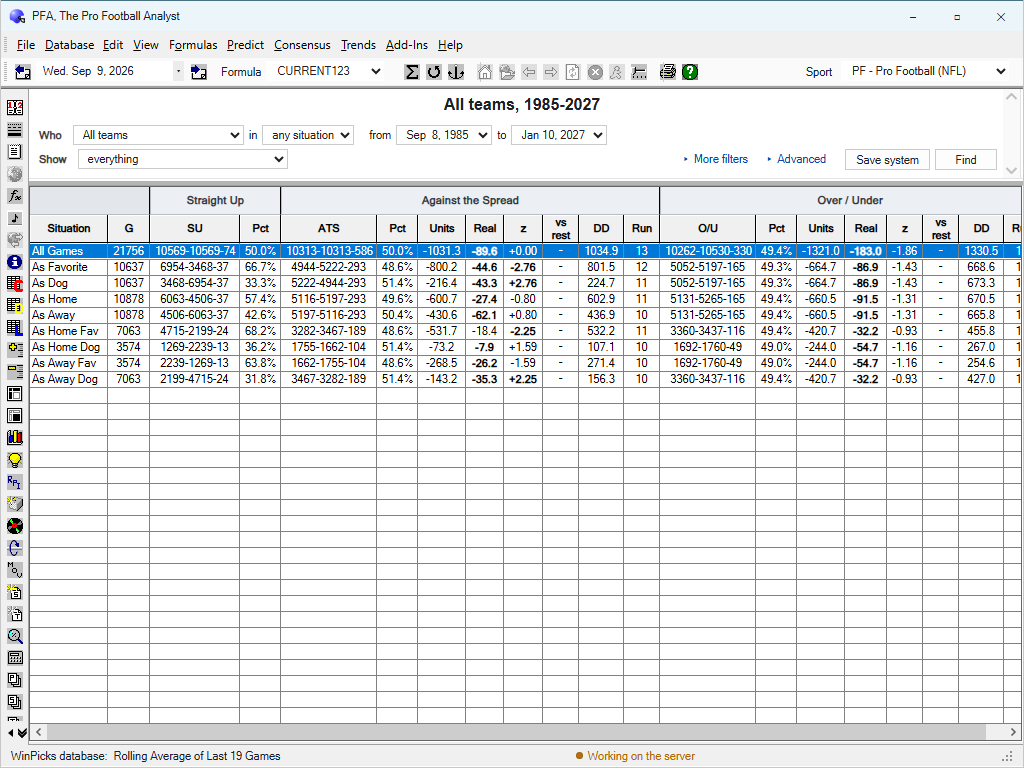
Figure 9.35 - The Trend Finder Screen (PFA)
Reading the screen, top to bottom. The title line states the question the grid below is answering, assembled in words - in the figure, "All teams, 1985-2027", because nothing has been narrowed yet. Under it the question is a sentence you edit: Who (one team, or all of them) in a situation from one date to another, and a Show list that reads "everything" until a filter makes it "custom". To the right sit the two panes and the two buttons: MORE FILTERS and ADVANCED open the filter controls, SAVE SYSTEM stores the query (see My Systems, the next section), and FIND runs it.
The situation list carries the nine classifications the program has always used - All Games, As Favorite, As Dog, As Home, As Away, and the four combinations of home and away with favourite and dog - and the answer always comes back as those nine rows, whatever the question. Rows the question makes impossible simply show 0-0-0: ask about home dogs and the As Away rows stay empty rather than disappearing.
The columns. The grid is three groups. Under Straight Up: G, the number of games the row covers; SU, the outright won-lost-tied record; and Pct. Under Against the Spread (and again, identically, under Over / Under):
- ATS (or O/U) - the record, won-lost-pushed against the number.
- Pct - its winning percentage, pushes excluded.
- Units - profit or loss betting one unit per game at a flat -110.
- Real - the same profit graded at the actual closing prices, for the games that carry one. Real spread and total prices are routinely -105 or -108, so the two columns differ more than you would expect - but they cover different games, so do not read them as a like-for-like pair. Hover a Real cell for the honest comparison: how many of the row's games were priced, and what -110 said about those same games.
- z - how far the record sits from what a coin would produce, in standard deviations. Printed bold when it clears the program's own significance test.
- vs rest - the honest comparison: a z-score against the same games without your filter, rather than against a coin. It is blank until the query carries a filter, because an unfiltered query is its own baseline. A filter that does not beat its own baseline found nothing, however good its record looks alone.
- DD - the worst peak-to-trough fall in units along the way, walked in date order, and Run - the longest string of consecutive losses. Units is where a system ended; these two are what it cost to hold on the way. A push moves no money, so it neither deepens a drawdown nor breaks a run.
The filters. MORE FILTERS and ADVANCED add, to the same question:
- a streak condition - after 2 losses, after 4 ATS wins, and so on. A toggle asks for exactly N rather than N or more, and a sweep runs the same query at every streak length from 1 to 6, so you can see whether an edge grows with the streak or is noise that vanishes by 3
- a line bin - only games where the spread fell in a bracket
- rest - only games with at least or at most so many days off
- month or day of week
- an opponent filter - division, conference or non-conference games
- a margin - only after a win or loss by more than so many points
- where (Pro Football Analyst) - the stadium type
- weather (Pro Football Analyst) - wind above a speed, temperature above or below a figure, rain or snow. Conditions are effective: a dome game is 70 degrees, no wind and dry whatever the sky did outside, and games with a retractable roof or no recorded data are excluded rather than guessed - so a cold-weather trend can never be built out of dome games by mistake
Line bins are per sport. Each sport brackets the spread on its own ladder, because the spreads are different sizes: pro football stops at "20 +" in nine brackets, the college games run to "30 +" in thirteen, and pro basketball starts at "PK -> 1.5" in twelve. The list you are shown is the one your sport actually uses.
The command box. Everything the controls can ask, a line of text can ask faster. The dark strip above the grid (Figure 9.36) takes either flags - trendquery --team Denver --cond 'After 2 Losses' - or plain English, and whatever you type is rewritten as the flags it understood, so you can see and correct the interpretation. Nothing you type is ever sent to a shell; the text is parsed in the page against a fixed vocabulary.
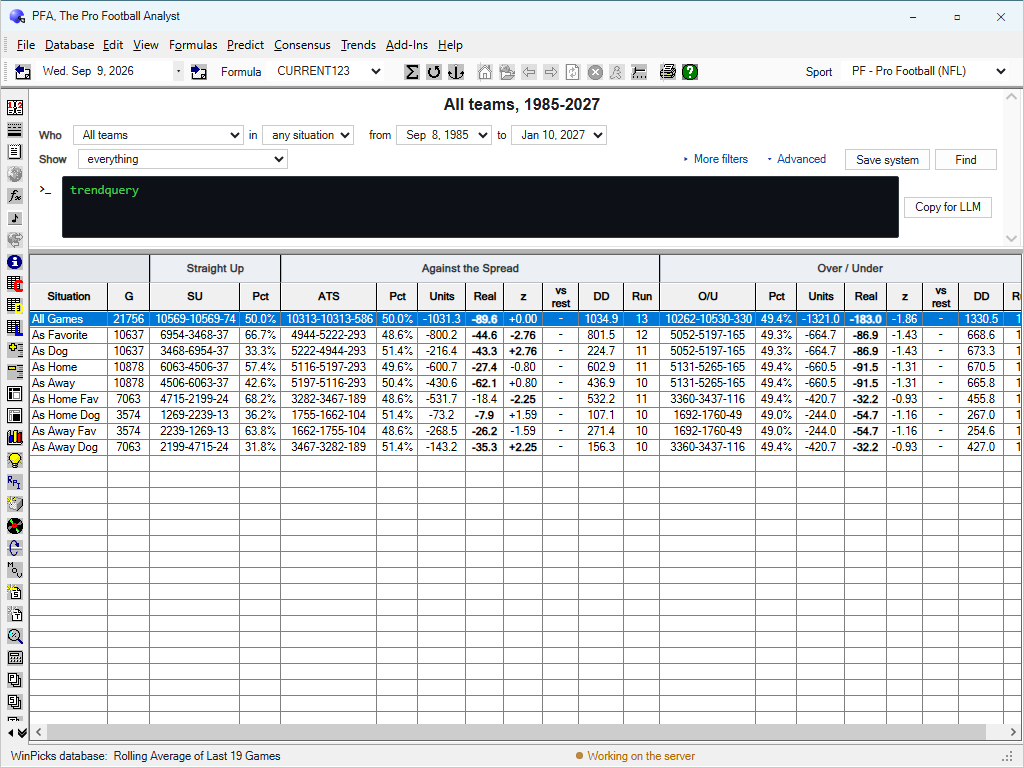
Figure 9.36 - The Command Box, with Copy for LLM Beside It (PFA)
Copy for LLM, the button at the box's right, copies the query, its result and the full flag vocabulary as one block of text, so you can paste it into any assistant you use and paste the command it suggests straight back into the box.
A worked question. Figure 9.37 shows the screen after asking: how do the Arizona Cardinals do as a home underdog, after two straight losses?
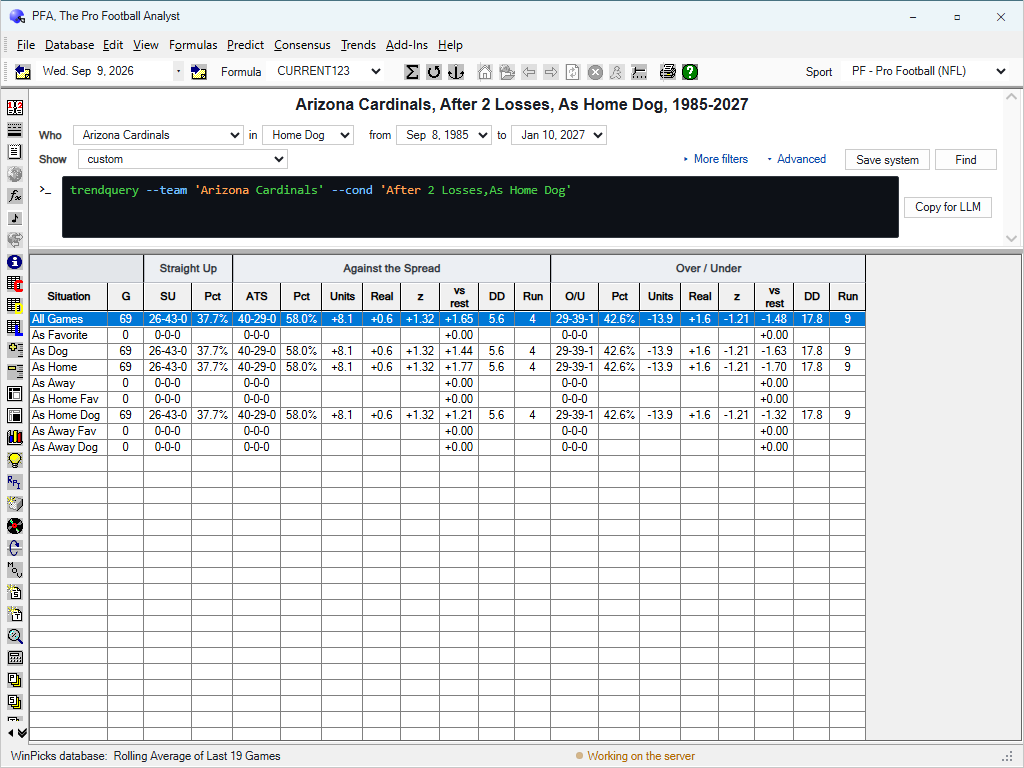
Figure 9.37 - A Question and Its Answer (PFA)
Everything on the screen now reflects the question. The title reads "Arizona Cardinals, After 2 Losses, As Home Dog, 1985-2027"; Who and the situation list have followed; Show reads "custom"; and the command box carries the rewritten flags: trendquery --team 'Arizona Cardinals' --cond 'After 2 Losses,As Home Dog'.
Now read the All Games row the way the columns are meant to be read. G 69: this has happened 69 times in four decades. SU 26-43, 37.7%: they usually lost the game itself - they were home dogs. ATS 40-29, 58.0%: against the spread they covered well. Units +8.1 at a flat -110; Real +0.6 - at the prices actually on offer, most of that profit was never there. z +1.32: a 58% record over 69 games sits within reach of a coin. vs rest +1.65: better than the same games unfiltered, but still short of significance. DD 5.6 and Run 4: even this record once sat 5.6 units under its own high-water mark and lost 4 straight. The rows below repeat the same 69 games under As Dog, As Home and As Home Dog - the situations the question implies - and 0-0-0 everywhere it cannot apply.
That is the screen teaching its own lesson: a headline record (58% ATS!) that neither the prices, the z-score nor the baseline comparison will vouch for. The columns exist so you find that out here, rather than at a betting window.
More questions, one per filter family. Each of these is a question worth asking, the command that asks it, and the column that decides the answer.
Streaks - does the edge grow with the cause?
trendquery --team Chicago --cond 'After 1 Losses' --sweep streakThe sweep answers the same question at streak lengths 1 through 6. Judge it the way the Weather Lab judges a curve: a real streak effect deepens as the streak lengthens - a gradient - while an "edge" that exists only at exactly 3 losses, with nothing at 2 or 4, is the noise that one bracket happened to catch. Read G at each length too: by 5-game streaks the sample is usually too thin to say anything.
Line bins - is it one fact or several?
trendquery --cond 'As Home Dog' --bin 3Home dogs of 10 to 13.5 points are a different animal from home dogs of 3 - the first is a team the market has given up on. Ask the brackets separately (or ask --cube for all of them at once) and read vs rest in each: the bracket has to beat the same games unfiltered, not a coin, before the bracket itself means anything.
Rest - measured, not assumed.
trendquery --cond 'As Away Dog' --rest-more 7Road dogs off a bye and more. Rest is the most theorised factor in handicapping and the least often measured; here the record is one command away. The honest reading is the pair of z columns: off-the-bye teams play in particular weeks and eras, so a fat record with a thin vs rest is the schedule talking, not the rest.
Opponent - the December division road favourite.
trendquery --cond 'As Away Fav' --opp division --month 12Division games in December are the games with standings on the line, and a road favourite there is a specific claim about class. Stack filters like this and watch G collapse - three filters can turn twenty seasons into sixty games, and sixty games prove almost nothing on their own. That is not a reason to skip the question; it is the reason the grid prints G first.
Margin - the letdown, quantified.
trendquery --team Denver --cond 'After 1 Wins' --after-pts 14The letdown spot: off a blowout win. The subtler versions ask the question against the market instead of the scoreboard - --after-pts-ats 14 for "beat the number by two touchdowns", which is a different team from one that merely won big as a big favourite.
Weather - and what the columns did to a famous one.
trendquery --cond 'As Home Fav' --wind-more 10Weather filters read effective conditions (domes neutralised, retractables excluded). Before trusting any weather record, re-read the measured example in The Weather Board and the Weather Lab, section 7: wind over 10 posted z -5.30 against a coin on 2021-23 totals, -4.08 against its own baseline, and -0.66 held out. The columns on this screen are how you run that same audit on any trend in a minute.
The ride - because Units is only where it ended.
The program's own measured illustration: New England after 2 ATS wins stood at +31.8 units - and along the way sat 17.3 units under its own high-water mark, with 6 consecutive losses inside it. DD and Run are what holding the system would actually have felt like; a record you would have abandoned in the drawdown is a record you would never have collected. You can even filter on the ride directly: --having 'ats.units > 20 and ats.dd < 12' (the full --having grammar is in Appendix C).
Saving. Press Save system and the query is stored, with today's date, in My Systems - where from now on it is graded only on games played after the save. See My Systems, the next section.
Availability. Trend Finder works in all five packages. Filters that read a box score statistic - rushing yards, time of possession - are offered in Pro Football Analyst only, because it is the only package whose database carries them. Filters reading weather, and the stadium filter, are likewise Pro Football Analyst only. Every other filter reads a score, a line or a date, which every package has.
A cookbook of worked commands - the question in words, the command, and how to read what comes back - is Appendix C, Trend Query Command Examples.
My Systems
A system is a Trend Finder query you have decided to follow. Choose Trends > My Systems to see yours. The screen is shown in Figure 9.38.
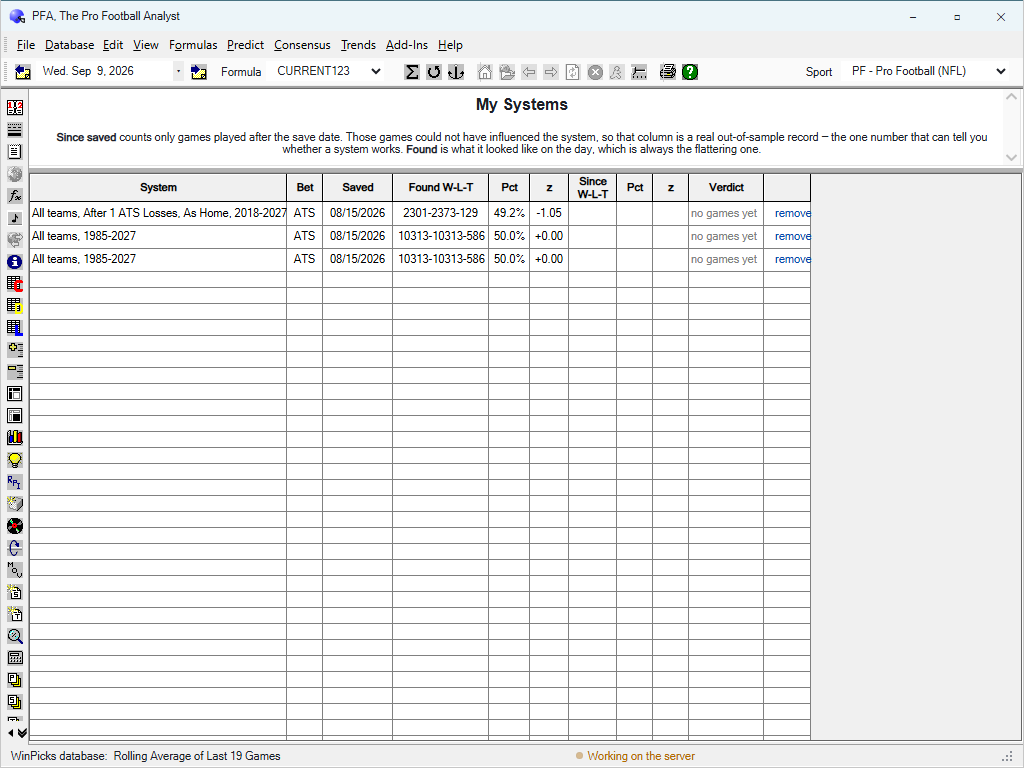
Figure 9.38 - The My Systems Screen (PFA)
To save one, build a query in the Trend Finder, press Find, then press Save system. The query is stored under your account with the date you saved it - and that date is the point of the whole screen. The note across the top of Figure 9.38 states the rule the columns follow.
The columns. System is the query, written the way the Finder's title line wrote it. Bet is the market it is graded on. Saved is the date the clock started. Then two records: Found W-L-T with its Pct and z - the record the query had on the day you saved it, always the flattering one, because you saved it for looking good - and Since W-L-T with its Pct and z, counting only games played after the save date. Those games could not have influenced what you saved, so the Since column is a true out-of-sample record: the one number that can tell you whether a system works, and the closest thing WinPicks has to a verdict. In Figure 9.38 the systems were saved in the off-season, so Since is empty and the Verdict column says "no games yet" - the screen would rather say that than judge early.
The verdict column reads the two together. A system whose Since record is winning units in the direction it was saved for shows holding; one that has gone the other way shows not holding; and until twenty games have been played it says there are too few games to judge, rather than judging early.
Removing a system deletes its saved date with it, and re-saving the same query later restarts the clock from that day. The screen warns you before removal, because an out-of-sample record is only meaningful while its start date stands.
The old Trend Seeker watch lists kept thousands of machine-found trends with no record of when each one was chosen, which is why they could never be checked honestly afterwards. My Systems is the repair: a few systems, chosen by you, each with its save date preserved and its later record measured against it.
Viewing Trends using the Trend Seeker Watch List or My Trends
WinPicks Reference Manual Section 9.4. Viewing Trends using the Trend Seeker Watch List or My Trends
WinPicks allows the trend handicapper to easily keep track and view trends they have uncovered using Trend Seeker, or trends saved to the My Trends list. Trends can be saved to My Trends using Team History, or by right clicking on any trend displayed by the Trend Seeker.
Viewing Trends using the Trend Seeker Watch List
The "Trend Seeker Watch Lists" display the most recent results from running the Trend Seeker. It can be used to check the results from the Trend Seeker, or to verify the most recent list is current.
After you select TREND SEEKER WATCH LISTS from the TRENDS menu, a window will ask which list you want to view. WinPicks always saves the last ten results of running the Trend Seeker in a list. This allows you to check trends from multiple watch lists without having to run the Trend Seeker again. The selection window is shown below:
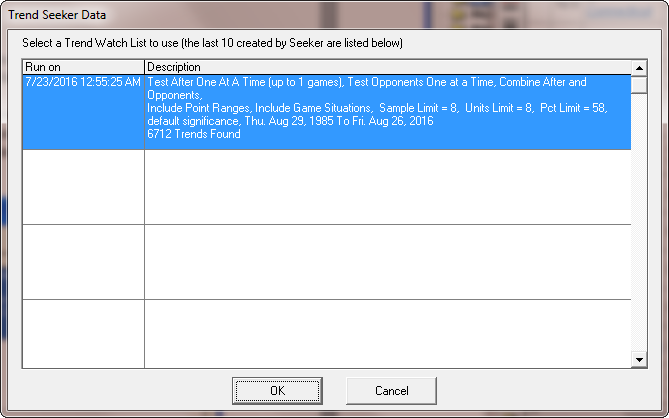
Figure 9.40 - The Trend Seeker Database Window (CFA)
Select a Trend Seeker database to view, and the "Watch List" window will be displayed next:
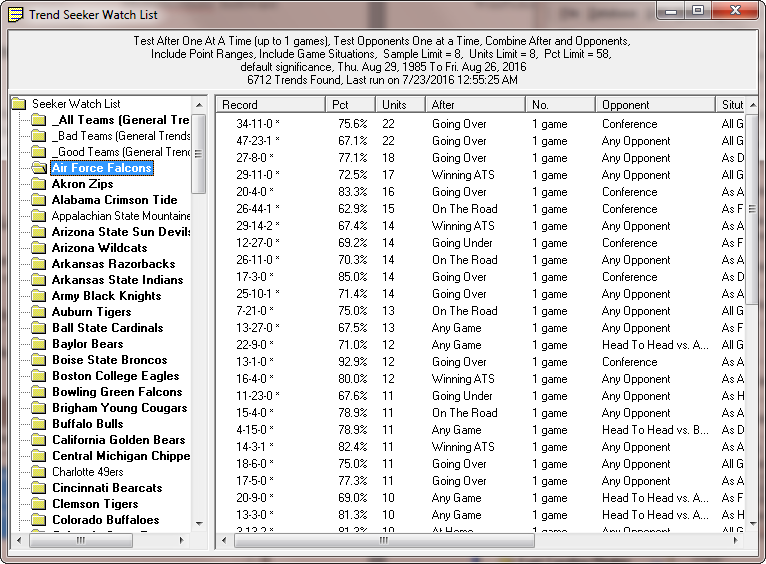
Figure 9.41 - The Watch List Window (CFA)
At the top of the "Watch List" window, the status of the most recent search is displayed. This is useful, since it indicates the last time that Trend Seeker was run, and the selections that were used.
Below the status information is a two-pane folder-and-list interface that lets you view the significant trend information in the watch list. The left pane of the interface allows you to display the trends found on a team by team basis, or the trends found for all teams. When you click on any of the folders in the left pane, the right pane will display the significant trends that were found.
The columns in the right pane include:
| Column Heading | Description |
|---|---|
| After | The "After" playing condition that matches the trend. |
| No. | The number of games (1-10) associated with the "After" condition. |
| Opponent | The "Opponent" condition that matches the trend. |
| Situation | The situation associated with this trend. Situations include "All Games", "As Home", "As Home", "As Favorite", "As Dog", "As Home Fav", "As Home Dog", "As Away Fav", and "As Away Dog." |
| Pt. Range | The point range the Vegas line was at for this trend. This can include "All Lines", or specific point range values that are unique to each sport. |
| ATS/OU | The type of trend found is displayed as ATS (against the spread, for sides) or OU (over/under, for totals). |
| Record | Displays the record for the significant trend that was found. ATS trend records are shown in this order: Won-Loss-Push. OU trend records are shown in this order: Over-Under-Push. |
| Pct | The winning percentage for this trend. The percentage is calculated using the side the trend favors. |
| Net Units | The net units for this trend. Net units are calculated using the side the trend favors, and using the standard method (Units = Wins - 1.1 x Losses). Trends with the most Net Units are initially displayed at the top of the list. |
| All columns in the watch list can be sorted. Click the button at the top of any column to sort the data based on that column. Click the button again to reverse the sort order. | After viewing the significant trends in the "Watch List", the window can be closed by clicking the "X" in the upper right hand corner. |
| Viewing Trends using My Trends | Select MY TRENDS from the TRENDS menu to view all of the trends you have saved. Trends that pertain to a team's conference are marked with a "(c)" next to the won-loss record. You can recalculate all your saved trends by clicking on the "Recalc" button, or right click on a trend to view the trend details or to remove the trend from the list (Figure 9.42). |
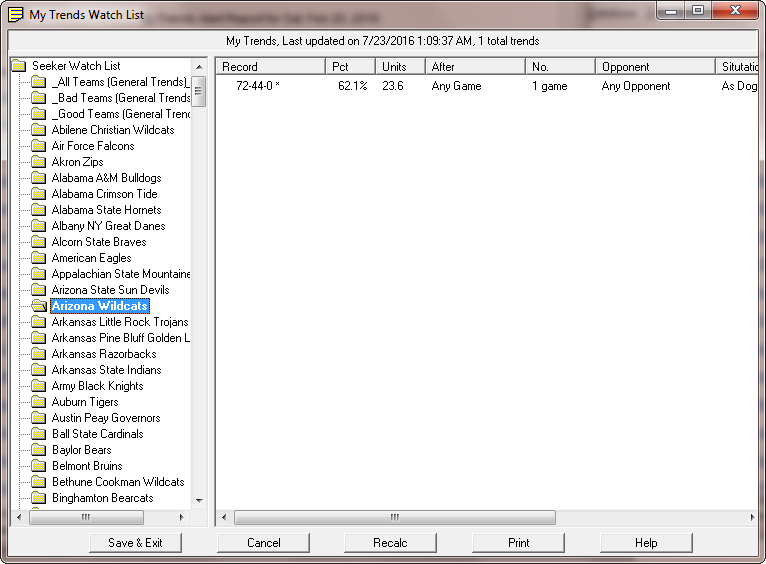
Figure 9.42 - The My Trends Watch List (CBA)
Using Trends to Generate Alerts
WinPicks Reference Manual Section 9.5. Using Trends to Generate Alerts
WinPicks allows you to generate alerts from trends you have uncovered using Trend Seeker, or from trends saved to the My Trends list. Trends can be saved to My Trends using Team History, or by right clicking on any trend displayed by the Trend Seeker.
Show Trend Seeker Alerts
Once a Watch List has been created with Trend Seeker, you can quickly see what games on the upcoming schedule match the trends. To do this, select SHOW TREND SEEKER ALERTS from the TRENDS menu. This feature will scan every game being played on the schedule against every trend in the watch list. If a match occurs, it will display the information.
After you select SHOW TREND SEEKER ALERTS, a window will appear asking you which Watch List you want to use. WinPicks always saves the last ten results of running Seeker in a list, letting you check trends from multiple Watch Lists without having to run Seeker again.
The Alerts report shows all games for the current date, similar to the screen below:
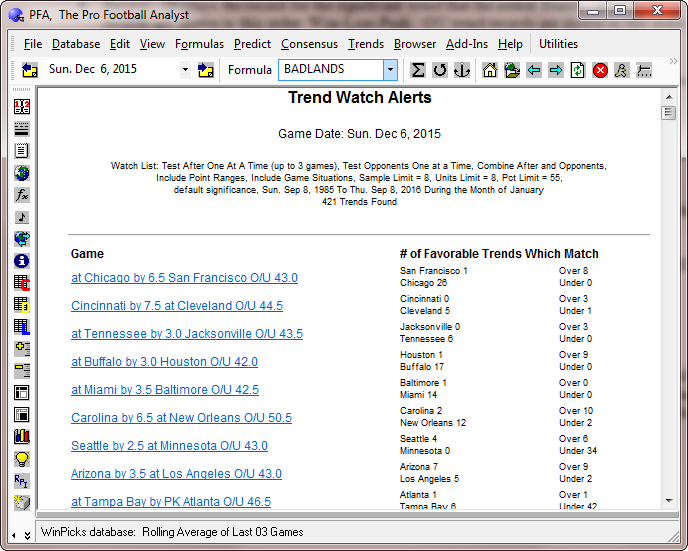
Figure 9.50 - The Trend Alert Report (PFA)
The "Trend Alerts" information is formatted as a web page. The top of the report contains summary information for each game on the schedule. The number of favorable trends that match each team (and over/under) summarized, with links to detailed trend information further down the page. You can also use the "Back To Top", "Previous", and "Next" links to move from game to game on the page.
How to Read the Trend Alert Report
Each game on the report is divided into two sections.
The first section is titled "Individual Team Trends Which Match." This section shows all of the matching trends found using specific team trends. For instance, suppose Baltimore is playing at home against Cincinnati. If Baltimore is 10-0 ATS at home after winning 2 games, and Baltimore has just won their last 2 games, the trend will be reported here.
The second section is titled "General (Any Team) Trends Which Match." This section shows trends found by Seeker when searching for general situations using all teams in the league. For instance, suppose all teams in the league are also winning significantly ATS at home after winning 2 games. Baltimore would also show up in the second section, since they match the general trend.
The team that matches a significant trend in always highlighted using Green or Red text for ATS trends. If the trend is favorable to the team, the name is displayed in Green text. If the trend is not favorable to the team, the trend is displayed in Red text.
For OU trends, the words Over and Under are highlighted in Green and Red to indicate what side the trend favors. For instance, if the word Over in shown in Green, it indicates the game is expected to go over.
At the top of the report, each game is summarized with the total number of favorable trends for each team, and for the over and under.
Trends that pertain to a team's conference are marked with a "(c)" next to the won-loss record.
Show My Trends Alerts
You can view the alerts for trends saved in your MY TRENDS list by selecting SHOW MY TRENDS ALERTS from the TRENDS menu. A screen similar to Figure 9.50 (above) will appear, listing all games on the schedule that match your stored trends.
Situation Analysis
WinPicks Reference Manual Section 9.6. Situation Analysis
SITUATION ANALYSIS summarizes many of the important trends that relate to a specific game. When you select SITUATION ANALYSIS from the toolbar, a list is displayed of all games scheduled on the current date. When you select a game from this list, a screen appears (Figure 9.60) showing how the two teams have performed in this situation in past games. Statistically significant trends are marked with an asterisk (*).
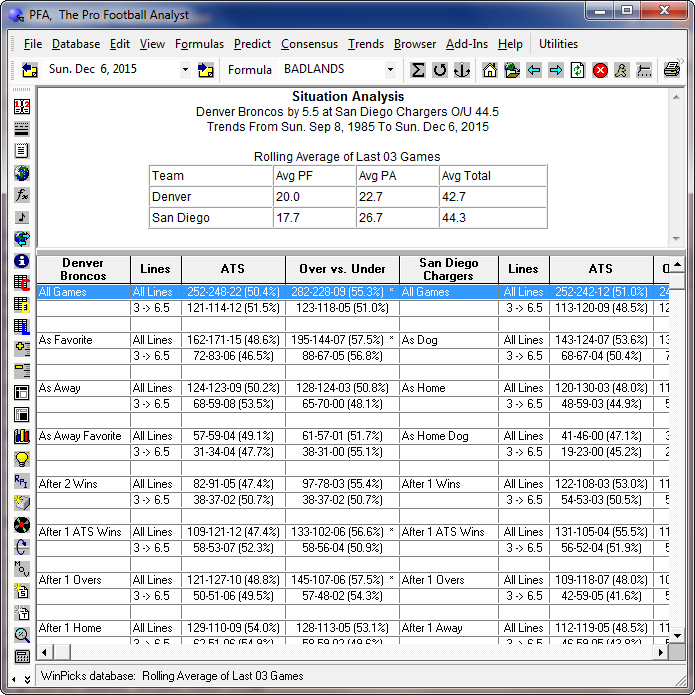
Figure 9.60 - The Situation Analysis Screen (PFA)
The Key Trends Report
WinPicks Reference Manual Section 9.7. The Key Trends Report
Once we know what a statistically significant trend is, wouldn't it be nice to quickly extract all of them from today's schedule? The KEY TRENDS feature - its button is on the toolbar - does exactly that, it lists all of the statistically significant trends for the currently selected date.
The KEY TRENDS feature lets you select the date range to scan when looking for trends. You can scan the entire database or just a portion of the database. The report then lists every game on the schedule for the current date. The number of statistically significant trends will vary widely from game to game, but it is always worth looking at this report. Most handicappers agree that "the trend is their friend" and find the KEY TRENDS report to be a useful handicapping tool.
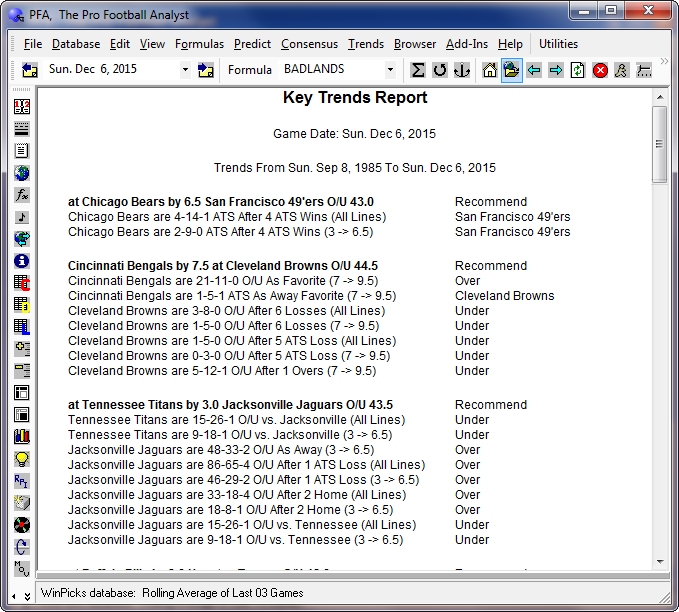
Figure 9.70 - The Key Trends Report (PFA)
Set Trend Options
WinPicks Reference Manual Section 9.8. Set Trend Options
When you use TEAM HISTORY or any of the other trend features in WinPicks, you may notice that some trends are marked with an asterisk (*). When you see an asterisk, it means that the team in question has done much better (or much worse) than average in this situation, and therefore this trend is considered to be statistically significant.
By default, WinPicks identifies trends that are more than two standard deviations from the mean as statistically significant. However, you can vary the number of standard deviations from 1 to 4 by choosing TREND SETTINGS from the TRENDS menu (Figure 9.80); the window it opens is titled Set Trend Options. This feature also allows you to change the settings that determine good and bad teams. By default, good teams are defined as having won more than 66.7 percent of their games over a period equal to about one season, and bad teams are defined as having won fewer than 33.3% of their games over the same interval. However, you can change the parameters to anything you wish.
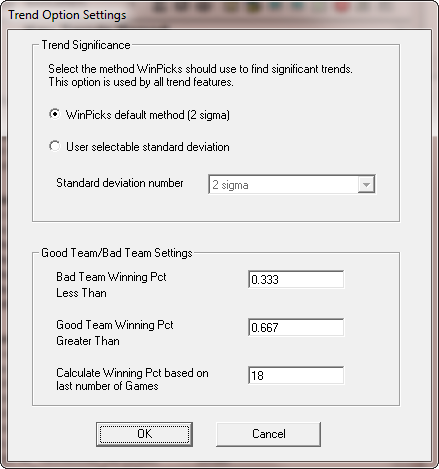
Figure 9.80 - The Set Trend Options Window
If you want to learn more about standard deviation, nearly any book on statistics will explain how to calculate it. However, one simple way to illustrate standard deviation is to empty a box of toothpicks onto a flat surface. When the toothpicks come to rest, most will remain clustered near the spot where they landed. This spot represents the average or mean. You'll probably see toothpicks spread out around the mean in a fairly consistent fashion. Statisticians call this normal distribution. As you get further and further from the mean, you'll see fewer and fewer toothpicks. If you recorded the final resting position of each toothpick and used the numbers to calculate standard deviation (distance from the mean), you would find that there is a high probability (about 68%) that a given toothpick will come to rest within one standard deviation of the mean. If you used two standard deviations (double the distance from the mean), you would find that there is a 95% probability that a toothpick will land within this range, or only a 5% probability that a toothpick will land outside this range.
The trends marked with an asterisk are just like the toothpicks that defied the odds and landed far away from the mean. They represent situations that are out of the ordinary, and thus deserve the attention of every handicapper.
This Week's Edges
WinPicks Reference Manual Section 9.9. This Week's Edges
Select THIS WEEK'S EDGES from the TRENDS menu for one ordered board across the whole slate: for each side of each game, the trend states that team is walking in with today, and what its history says about each. It inverts the alerts in section 9.5. Those check a watch list you have already built against the day's games; this asks the opposite question - given the state each team is actually in, which of those states has a history worth reading?
An edge appears only when both halves hold: the team is in the state, and the state's record clears a minimum of 30 games and 2.0 from a coin flip. Either alone is noise. The history counts games strictly before the date, so the result being predicted never leaks into the trend predicting it. The engine tests many conditions per game, so some of what clears arrives by chance; the line above the table says how many.
The board has a row per edge: the TEAM, the TREND it is in, the BET (SU, ATS or OU), the RECORD, COVER percentage, how far the record is FROM A COIN FLIP, the UNITS at the prices on file, REAL / PRICED - the units over the bets that carry a real recorded price, and how many that is - the worst DRAWDOWN the record went through, and the BET the trend points at, so a fade is not mistaken for a back. Use the sort and the SU/ATS/OU choice at the top to order the board the way you read it.